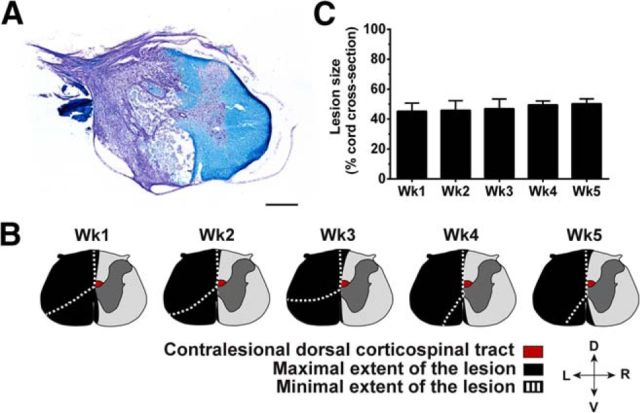
Figure 2.
Extent of the spinal lesions. A, Microphotograph of a coronal spinal cord section at thoracic (T8) level after lateral hemisection stained with cresyl violet (cell bodies, purple) and luxol fast blue (myelin, blue) indicating damage to gray and white matter in the left hemicord including the dorsal CST (shown in B) with majority sparing of the right dorsal corticospinal tract. Scale bar, 500 μm. B, Schematic drawings of the largest (black fill) and smallest (white dashed lines) lesion area within each group. D, Dorsal; V, ventral; L, left; R, right. C, Comparisons of the extent of maximum cross section lesion area as a percentage of total cross section area in hemisection groups (n = 8 rats/group). No statistical differences in lesion size was observed between groups (ANOVA, p = 0.219). Data are plotted as group mean ± SD. See also Figure 2-1 for individual values and Figure 3 demonstrating that contralesional hindlimb motor maps are abolished, whereas the majority of ipsilesional hindlimb motor map area is preserved acutely (1 h) after hemisection.

