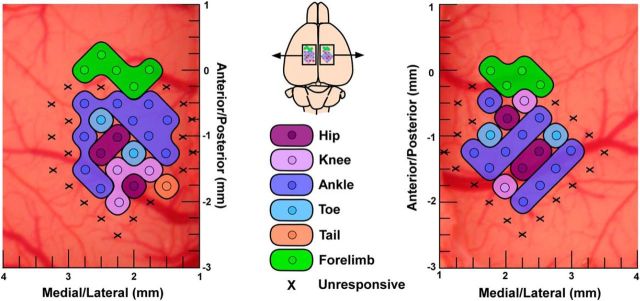
Figure 5.
Representative hindlimb motor maps in an intact rat derived with ICMS. Stimulation sites evoking contralateral hindlimb movements of the hip (purple), knee (pink), ankle (dark blue), and toe (light blue) at ≤100 μA. The hindlimb representation is bounded by forelimb responses at its anterior border (green). Tail movement is indicated in orange. Unresponsive stimulation sites (showed by X) mark the medial, lateral, and posterior hindlimb representation borders.

