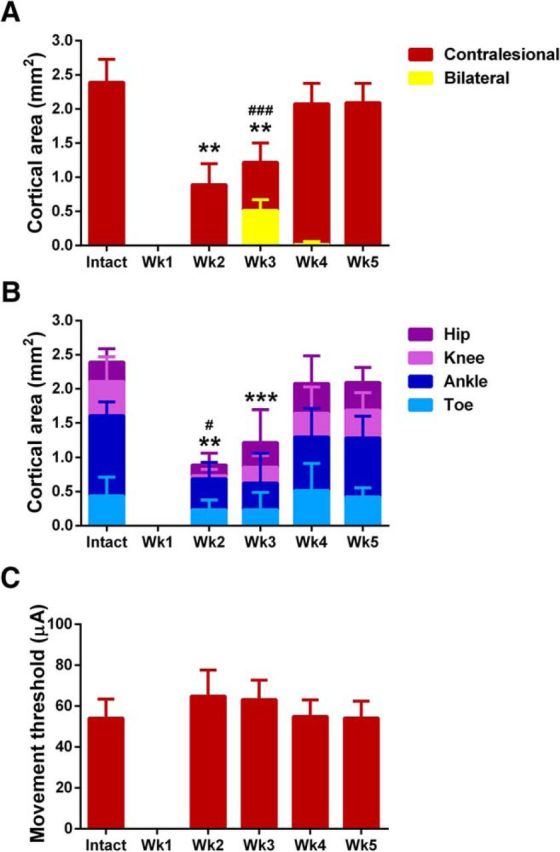
Figure 7.

Quantification of ipsilesional motor map reorganization. A, ICMS of the ipsilesional motor cortex evoked movement in both hindlimbs 3 weeks after hemisection, but not in the intact state. Statistical differences in the cortical area evoking bilateral hindlimb movement after hemisection from the intact state is showed by ### (p < 0.001, Mann–Whitney test). Statistical differences in the cortical area evoking contralateral hindlimb movement is showed by ** (p < 0.01, ANOVA supplemented with Tukey HSD). B, The smaller hindlimb motor maps in the ipsilesional motor cortex 2–3 weeks after hemisection were related to a significant decrease in ankle (showed by **p < 0.01 and ***p < 0.001, Tukey HSD) and knee (showed by #p < 0.05, Tukey HSD) representation. C, Movement thresholds did not significantly differ between postlesion groups (p = 0.0701, ANOVA). All data are plotted as group mean ± SD (n = 8 rats/group). See also Figure 2-1 for individual values.
