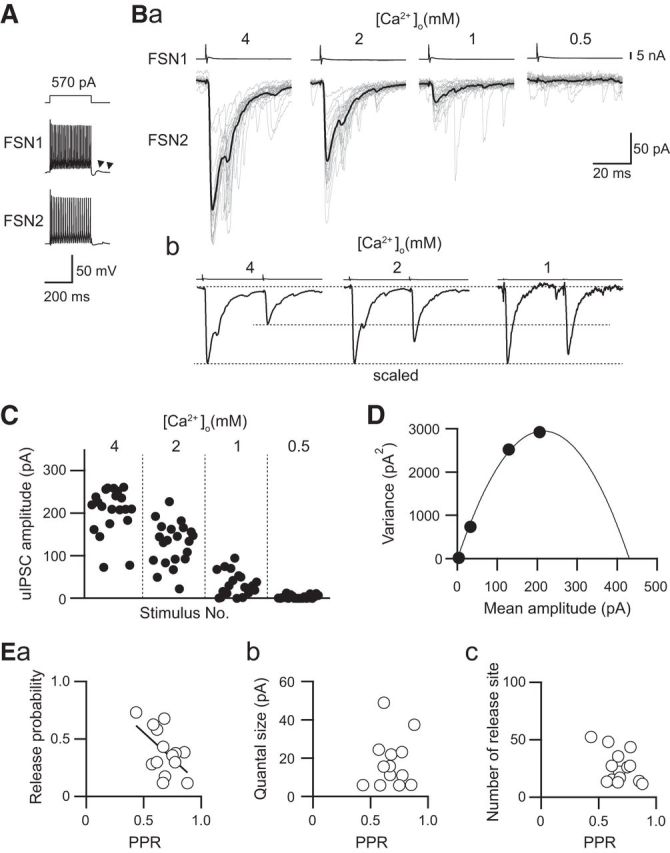
Figure 4.

PPR depends on the putative release probability revealed by variance–mean analysis. A, Repetitive firing of presynaptic and postsynaptic FSNs (FSN1 and FSN2, respectively). Autaptic responses were observed just after the end of the depolarizing pulse applied to FSN1 (arrowheads). B, uIPSCs recorded under the application of 4.0, 2.0, 1.0, and 0.5 mm [Ca2+]o ACSF (a). uIPSCs responding to paired-pulse stimulation of the presynaptic FSN1 are shown in b. The amplitudes of the first uIPSCs are scaled. Responses under 0.5 mm [Ca2+]o are not shown because of their negligible amplitude. C, Distribution of the uIPSC amplitude in response to 0.5–4.0 mm [Ca2+]o ACSF obtained from 20 consecutive trials. D, Mean uIPSC amplitude and their variance are fitted with a quadratic function. Data were obtained from the same connection between FSN1 and FSN2 as shown in A–C. E, Summary of the relationship between the PPR and putative release probability (a), quantal size (b), and the number of release sites (c). Note a significant correlation between the PPR and release probability (n = 14, r = −0.545, p = 0.044, Pearson correlation).
