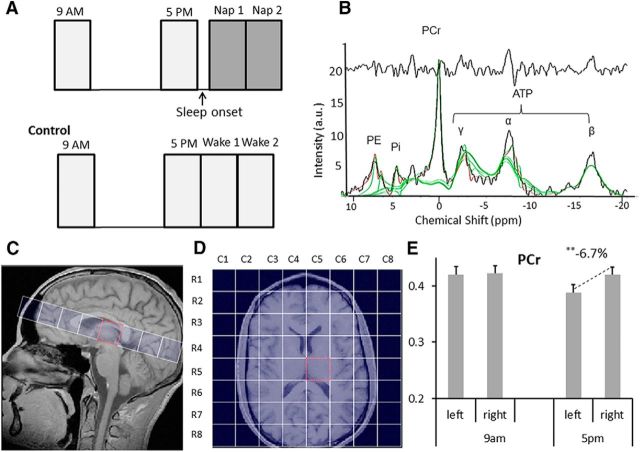
Figure 1.
A, Study design. Top, Subjects were measured in two sessions, one in the morning at 9 A.M. and one in the afternoon at 5 P.M. of the same day. After the afternoon 5 P.M. scan at wake state, 15 subjects remained positioned in the scanner and were further measured while napping. Each measurement lasted 20 min. Bottom, 10 controls underwent the same protocol but stayed awake during the second and third scan of the 5 P.M. session. B, 31P spectrum of the left thalamic voxel (R5, C5) after postprocessing with Tarquin. The upper black line represents residuals after fitting. The green and red lines are the fitted and modeled linear combination of monomolecular basic spectra. C, Sagittal view with the grid placed parallel to and 2 mm under the anterior commissure–posterior commissure plane. D, Axial 2D flash image in radiological orientation (left hemisphere at the right image side) overlaid with the CSI grid of 8 × 8 voxels. E, Comparison of PCr levels in the left (R5C5) and right (R5C4) thalamus voxel. In the morning the intraindividual left–right percentage difference averaged −1.9%, rising in the afternoon to highly significant −6.7%. Error bars denote SEM.

