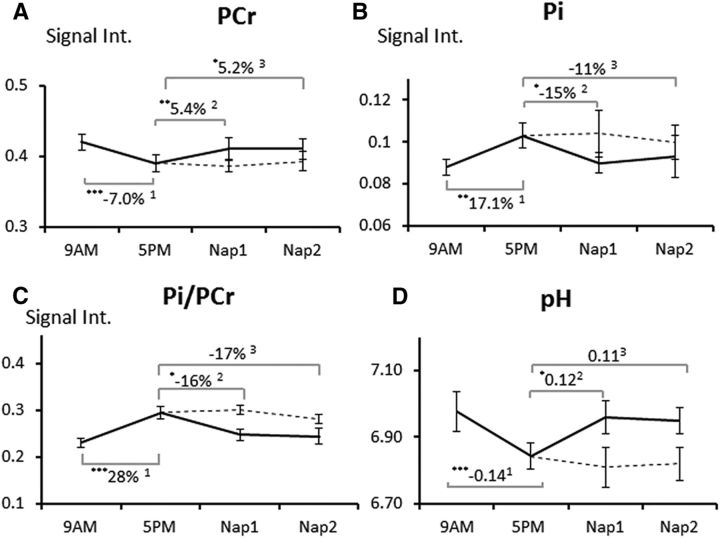
Figure 2.
A–D, Plots of the courses of PCr (A), Pi (B), metabolic ratio Pi/PCr (C), and pH level (D) in the left thalamus 15.6 ml voxel throughout the four conditions assessed. Dotted lines represent the control group that did not nap. Note the inverse course of Pi and Pi/PCr versus PCr and pH, respectively.

