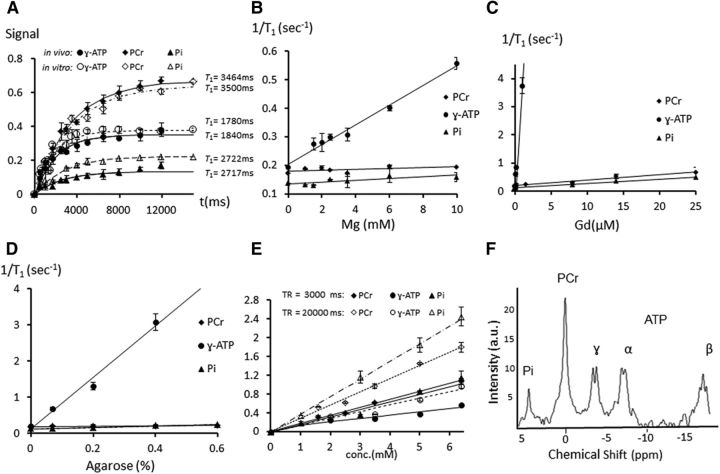
Figure 6.
31P-MRS signal saturation studies of PCr, γ-ATP, and Pi, of relaxation times (T1), and of relaxation rates (1/T1): A, Comparison of saturation curves in vivo in four subjects with those of best matching phantom preparations containing all 2.5 mM PCr, 3.5 mM ATP, and 1.0 mM Pi and 8 μM Gd for PCr, 0.1 μM Gd for ATP, and 14 μM Gd for Pi. B–D, Relaxation rate (1/T1) of PCr, γ-ATP, and Pi in solutions with different concentrations of Mg2+ (1–10 mM), Gd (0.07–25 μM) and agarose (0.07–0.6%). E, Calibration lines for PCr (diamond), ATP (circle) and Pi (triangle) signal covering the concentration range 1–6.4 mM measured at TR = 3000 ms (filled symbols) and at saturated level with TR = 20 000 ms (open symbols). The in vivo PCr, γ-ATP and Pi level in the thalamus region at 9 AM corresponded to a concentration of 2.40, 2.91 and 0.8 mM (n = 30), respectively. Error bars indicate SEM. F, 31P spectrum of the R5, C5 voxel of a phantom containing 2.5 mM PCr, 3.5 mM ATP, 1.0 mM Pi and 0.44% agarose placed inside a human skull.

