Figure 5.

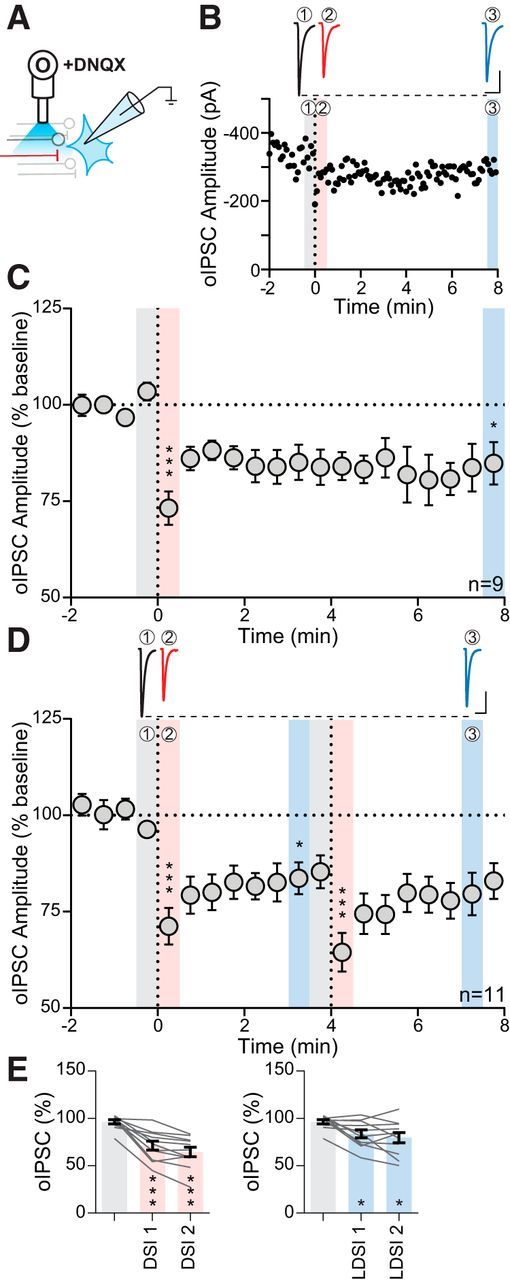
oIPSCs exhibit LDSI. A, Experimental setup of optical fiber placement for BNSTFu stimulation. B, Representative oIPSC traces (top) and amplitude time course (bottom) from an individual cell following a single postsynaptic depolarization. C, Summary time course showing that LDSI in 9 cells from 7 mice (6 male, 1 female) persists for many minutes following a single postsynaptic depolarization (F(2,8) = 13.52, p = 0.0012). D, Top, Traces of oIPSCs corresponding to shaded regions below. Bottom, Summary time course showing that LDSI in 11 cells from 11 mice (2 male, 9 female) is not enhanced by repeated postsynaptic steps (PD1: F(2,10) = 18.60, p = 0.0001, PD2: F(2,10) = 10.70, p = 0.0016). E, Summary graphs data corresponding to shaded regions in D showing DSI (F(2,10) = 39.38, p = 0.0001) and LDSI (F(2,10) = 7.94, p = 0.0055) values compared with the initial baseline indicating that LDSI2 remains significantly depressed compared with the initial baseline. Scale bars, 100 pA, 20 ms. Post hoc versus baseline p-values are shown as follows: *p < 0.05, ***p < 0.001. Data are shown as mean ± SEM.
