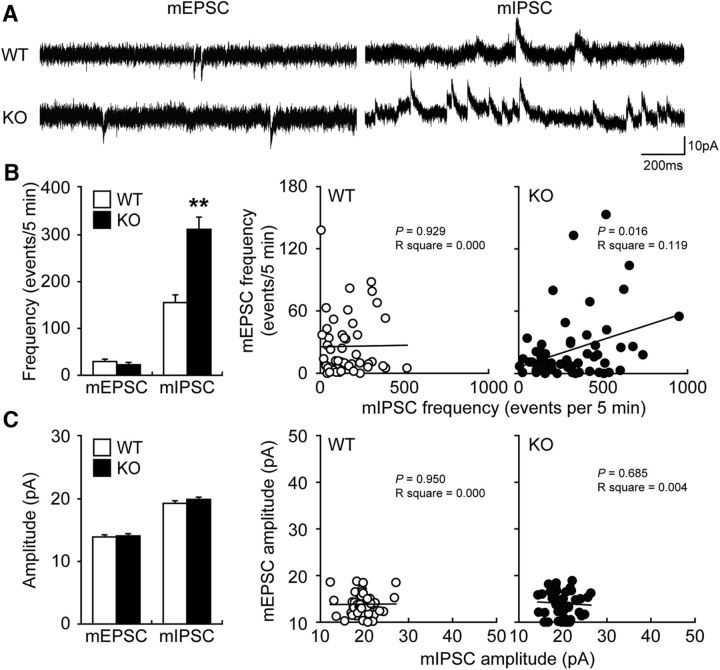
Figure 3.
Enhancement of inhibitory synaptic plasticity in the ACC of Fabp3 KO mice. A, Representative traces of mEPSCs and mIPSCs in ACC layer II/III pyramidal neurons. B, Plots of the mEPSC and mIPSC frequencies in WT and Fabp3 KO mice. C, Plots of the mEPSC and mIPSC amplitudes in WT and Fabp3 KO mice. n = 53 cells for WT and 59 cells for Fabp3 KO from 5 mice for mEPSCs. n = 52 cells for WT and 60 cells for Fabp3 KO from 5 mice for mIPSCs. **p < 0.01 versus WT mice. Error bar indicates mean ± SEM.

