Figure 5.
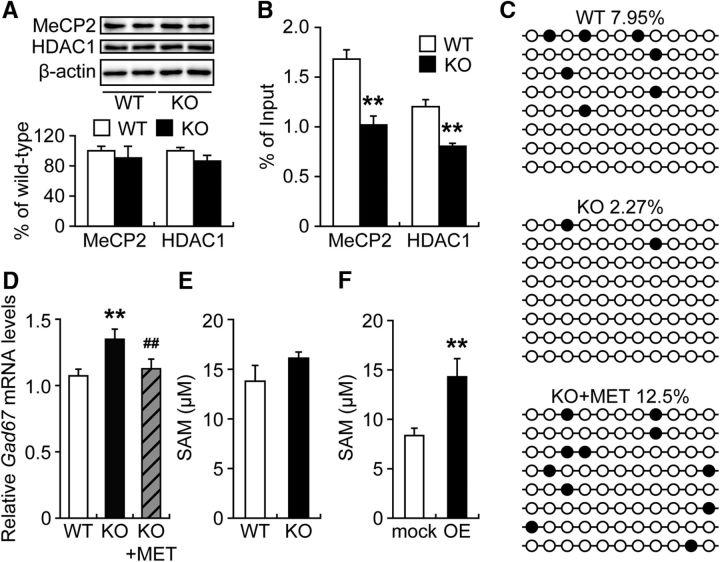
Decreased binding of MeCP2 and HDAC1 to the Gad67 promoter region in the ACC of Fabp3 KO mice. A, Representative immunoblots (top) and quantitative densitometry analysis (bottom) probed with various antibodies are shown. n = 6 mice per group. B, ChIP assay of ACC extracts from WT or Fabp3 KO mice via anti-MeCP2 and HDAC1. The precipitated DNA was analyzed by qPCR with primers amplifying the Gad67 promoter region. **p < 0.01 versus WT mice. n = 5 WT mice. n = 4 Fabp3 KO mice. C, DNA methylation profile in the Gad67 promoter region determined by bisulfite sequencing. Black circles represent methylated CpGs. Open circles represent unmethylated sites. Top numbers indicate global percentages of methylated cytosines. D, Quantitative analysis of the Gad67 mRNA expression in the ACC. WT, n = 6; KO, n = 5; KO + MET, n = 6 mice per group. **p < 0.01 versus WT mice. ##p < 0.01 versus KO mice. E, F, Quantitative analysis of the SAM concentration by ELISA. n = 4 per group. **p < 0.01 versus mock control. MET treatment (5.2 mmol/kg, s.c., twice per day for 6 d). mock, Mock control; OE, Fabp3 overexpression. Error bar indicates mean ± SEM.

