Figure 3.
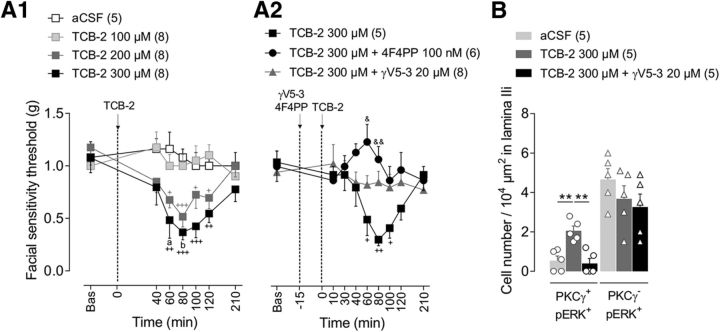
PKCγ is involved in TCB-2-induced facial mechanical allodynia. A1, A2, Time courses of facial mechanical sensitivity thresholds measured by von Frey filaments before (Bas, baseline) and after intracisternal administrations of aCSF or increasing doses of TCB-2 (100, 200, and 300 μm; 5-HT2AR agonist) (A1), or either TCB-2 (300 μm) or TCB-2 (300 μm) + 4F4PP (100 nm, 15 min before TCB-2) or TCB-2 (300 μm) + γV5-3 (20 μm, 15 min before TCB-2) (A2). Note that TCB-2-induced facial mechanical allodynia is dose dependent and is prevented by prior administration of γV5-3 or 4F4FP. Symbols represent mean ± SEM of n animals per group. +p ≤ 0.05, ++p < 0.01, +++p < 0.001 versus corresponding baseline by Dunnett's post test following two-way repeated-measures ANOVA; ap ≤ 0.05 and bp < 0.01 versus aCSF group by Tukey's HSD post test following two-way repeated-measures ANOVA; &p ≤ 0.05, &&p ≤ 0.01 TCB-2 versus TCB-2+4F4PP group by Tukey's HSD post test following two-way repeated-measures ANOVA. B, Bar histograms showing the density of double-labeled PKCγ/pERK1/2-IR interneurons (PKCγ+/pERK+) and PKCγ−/pERK+ ones within MDH lamina IIi after intracisternal administration of aCSF, TCB-2 (300 μm), or TCB-2+γV5-3 (20 μm, 15 min before TCB-2). Note that innocuous mechanical stimulation of the face by 0.07 g von Frey filament after intracisternal TCB-2 injection elevates pERK1/2-IR in PKCγ+ interneurons, but not in PKCγ− interneurons, and such elevation is prevented by intracisternal γV5-3. Bars represent mean ± SEM n animals per group. Each symbol is the mean value of three to four slices for a single animal. **p < 0.01 TCB-2 versus aCSF and TCB-2 versus TCB-2+γV5-3 by Tukey's HSD post test following one-way ANOVA.

