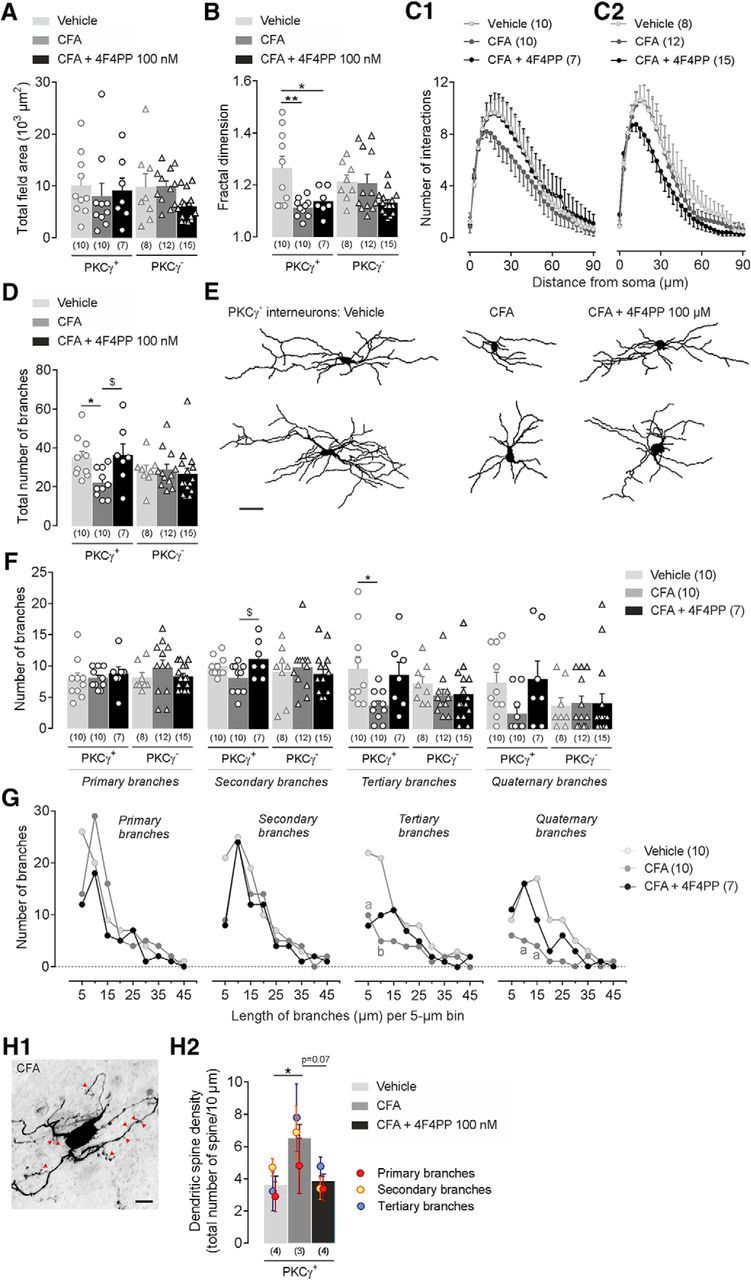
Figure 6.

CFA-induced facial inflammation produces structural modifications of MDH lamina IIi interneurons. A–H, Morphological features of 3D-reconstructed neuritic arbors of neurobiotin-labeled PKCγ+ and PKCγ− interneurons after subcutaneous injection into the vibrissa pad of saline (vehicle) or CFA (2.5 mg/kg) or CFA+4F4PP (100 nm, injected i.c. 30 min before CFA). For bar histograms, bars represent mean ± SEM of n neurons per group and each symbol is the value for a single neuron. A, B, Total field area (A) and fractal dimension (B) of PKCγ+ and PKCγ− interneurons in the different experimental groups. *p ≤ 0.05 and **p < 0.01 by Tukey's HSD post test following one-way ANOVA. C1, C2, Sholl analysis curves of PKCγ+ (left) and PKCγ− (right) interneurons showing the number of branching intersections as a function of path length from soma. Symbols represent mean ± SEM of n neurons per group. D, Number of neuritic branches of PKCγ+ and PKCγ− interneurons in the different experimental groups. *p ≤ 0.05 and $p ≤ 0.05 by Tukey's HSD post test following one-way ANOVA. E, Representative neuronal reconstructions showing the neuritic aborizations of PKCγ+ interneurons. F, Number of primary, secondary, tertiary, and quaternary branches of PKCγ+ and PKCγ− interneurons in the different experimental groups. *p ≤ 0.05 and $p ≤ 0.05 by Tukey's HSD post test following one-way ANOVA. G, Curves showing the primary, secondary, tertiary, and quaternary branch distribution of PKCγ+ interneurons according to their length. Symbols represent the number of branches per 5 μm bin. ap ≤ 0.05 and bp < 0.01 versus vehicle group by Tukey's HSD post test following two-way repeated-measures ANOVA. H1, Representative confocal fluorescence images showing dendritic spines (red arrowheads) in a PKCγ+ interneurons after CFA injection into the vibrissa pad. H2, Number of spines per 10 μm in PKCγ+ interneurons. Symbols represent mean ± SEM of spine numbers on the corresponding primary, secondary, and tertiary branches. *p ≤ 0.05 and p = 0.07 by Tukey's HSD post test following one-way ANOVA.
