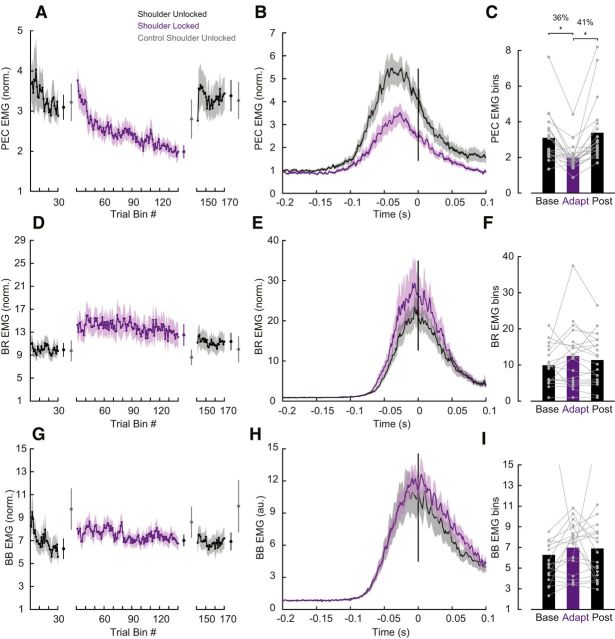
Figure 3.
Learning novel intersegmental dynamics following shoulder fixation. A, Average PEC muscle activity in a fixed time window (−100 to 100 ms relative to movement onset). Each data bin is the average of five trials. Shaded areas represent the SEM. EMG data are normalized as described in Materials and Methods. Error bars plotted between the epochs represent the mean and SE of the last five bins of trials in each phase contrasted with the respective bins in the control experiment in gray. B, Time series of PEC normalized muscle activity averaged over the last 25 baseline and adaptation trials. Data are aligned on movement onset. Shaded areas represent the SEM. C, Average PEC muscle activity in a fixed time window (−100 to 100 ms relative to movement onset) associated with these trials late in the baseline, adaptation and post-adaptation phases. Each dot represents data from a single participant. Asterisks indicate reliable effects (p < 0.05; see main text). D–F, Data for elbow BR muscle are shown using the same format as A–C. G–I,Data for BB muscle are shown using the same format as A–C.

