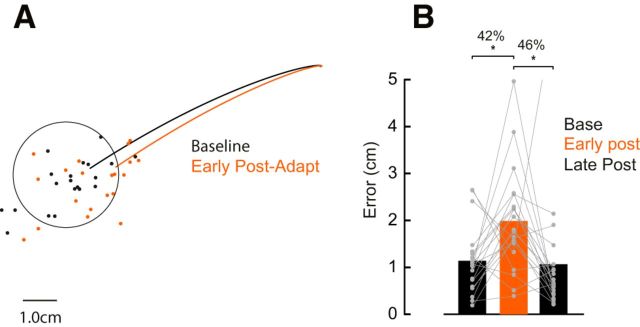
Figure 4.
Movement trajectories after adapting elbow reaches. A, Average hand trajectories late in the baseline (25 trials) and early in the adaptation trials (first 3 trials). Each dot represents data from a single participant. B, Average error between hand position at movement offset to the center of the target in the last 25 trials in the baseline, first 3 trials early in the post-adaptation, and last 25 trials late in post-adaptation phases (p < 0.05; see main text). Asterisks indicate reliable effects. Each dot represent data from a single participant.

