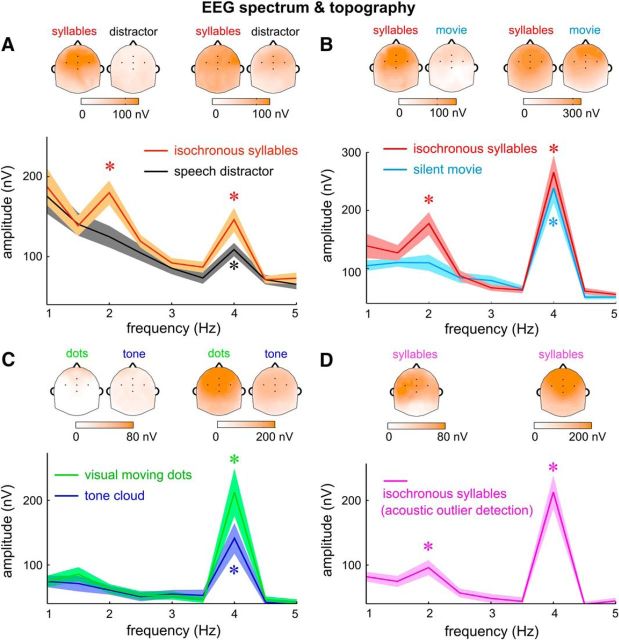
Figure 3.
Attentional and task modulation of the neural response spectrum. The EEG spectrum is the root mean square over participants and channels. A–D, Results from Experiments 1–4 respectively. Different experimental conditions are color coded and the attentional focus of the participants in each condition is labeled. Stars indicate frequency bins with amplitude higher than the amplitude averaged over a 1-Hz-wide neighboring frequency region (*p < 0.005, bootstrap). Response peak at the syllable rate was observed in all tested conditions. Response peak at the word rate, however, was only observed when the isochronous syllable sequence was attended to. The topographic plots of the EEG response at the syllable and word rates are shown above the corresponding spectrum, which generally shows a central-frontal distribution. In the topographic plots, the EEG response is normalized by subtracting mean amplitude over a 1 Hz neighboring frequency region (excluding the target frequency). The five black dots in the topographic plots show the position of FCz (middle), Fz (upper), Cz (lower), FC3 (left), and FC4 (right). Figure 3-1 shows additional spectral analysis of Experiment 3.

