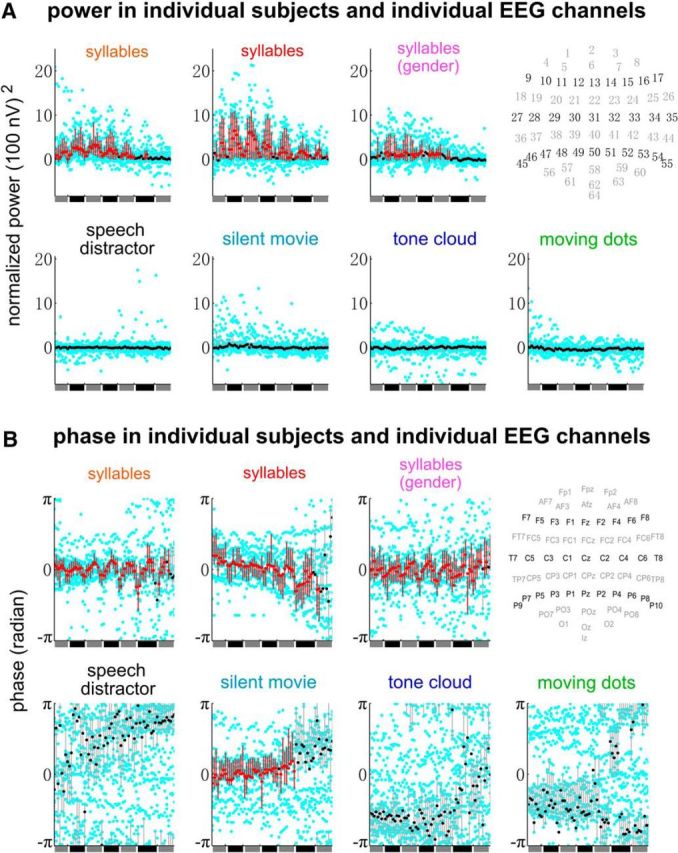
Figure 5.

Word-rate response power and phase in individual EEG channels and individual participants. The power is the evoked power (i.e., power of the EEG waveforms averaged over trials) and is normalized by subtracting the power averaged over neighboring frequency bins (≤0.5 Hz on each side). Data from each participant are shown by cyan dots and the average over participants is shown by black dots. The x-axis represents EEG channels and the channel index, from 1 to 64, goes from left to right. The approximate scalp position of each channel is shown at the upper right corner of each panel. A vertical bar shows the range between the 25th and 75th percentile for power, and the minimal phase range covering 50% participants for the response phase. The bar is red if and only if the normalized power is significantly >0 in A or if the interparticipant phase coherence is significantly higher than chance in B (p < 0.01; see Materials and Methods; false discovery rate corrected). The experimental condition is labeled in the title of each plot and the 3 plots in the upper row of panels A and B show the conditions where the isochronous syllable sequence was attended to.
