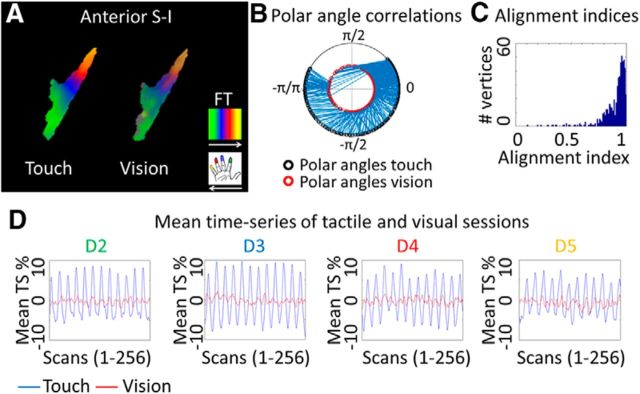
Figure 3.
Similarity between tactile and visually-induced finger maps in contralateral primary somatosensory cortex. A, Similar topographic arrangements of mean tactile and mean visual maps in anterior S-I (averaged phase-maps over 16 participants displayed in the tactile finger map ROI of contralateral area 3b).The FreeSurfer surface label of area 3b was used for masking. B, Spoke plot visualizes the polar angle correlation between visual and tactile time series; data were extracted from the tactile finger map ROI in area 3b. The correlation was significant (p < 10−15). C, Histogram plots the number of vertices against visuotactile phase angle map similarities (alignment indices range between 0 and 1, 1 indicates maximal alignment; Sereno and Huang, 2006). See Figure 5 for histograms of each individual participant. D, Mean time series in percentage units (averaged over 16 participants, displayed for 256 scans) of tactile and visual datasets, extracted from D2 (index finger), D3 (middle finger), D4 (ring ringer), and D5 (small finger) receptive areas (shown are values averaged over all vertices of the respective ROI).

