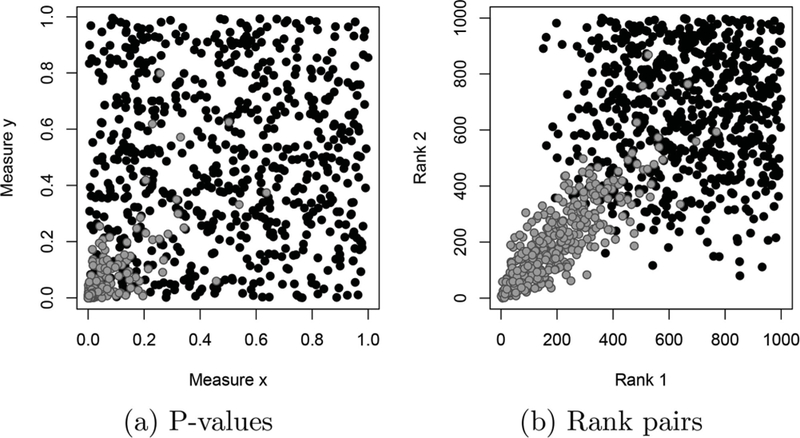
Figure 1.

P-values (a), and corresponding rank pairs (b) for 1000 genes, 350 of which are reproducible. Gray points indicate reproducible genes, while black points indicate irreproducible genes. Note that irreproducible genes are generally ranked lower than the reproducible ones.
