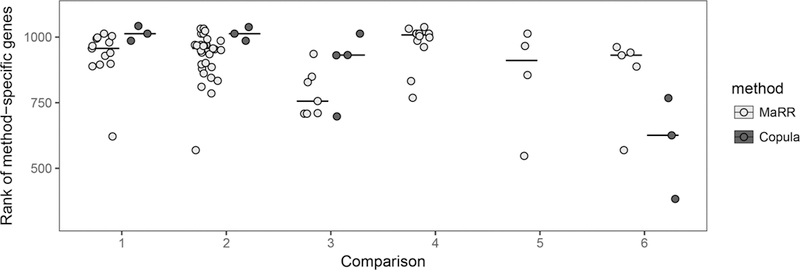
Figure 10.

Rank of method-specific PCR genes in the top k for only MaRR (light gray) or for only the copula mixture model (dark gray) for comparisons 1–6. Horizontal lines indicate median values. Here, k is determined by the number of transcripts declared reproducible by the MaRR procedure for α = 0.01. PCR genes with lower-valued ranks are more highly expressed. In all comparisons, more PCR genes are identified only by the MaRR procedure than the copula mixture model. For comparisons 4 and 5, there were no PCR genes identified only by the copula mixture model.
