
Figure 2.
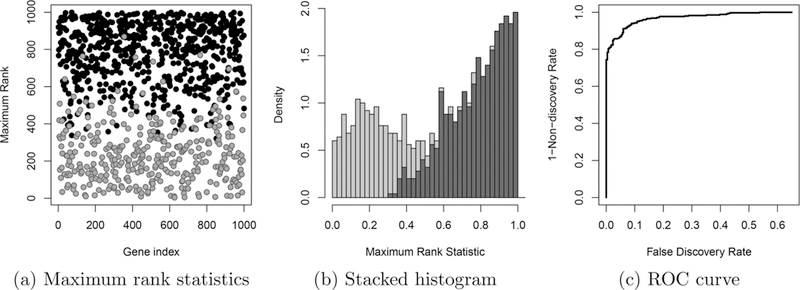
Maximum rank statistics presented two ways, (a) and (b), and corresponding receiver operating characteristic (ROC) curve using Mg as the basis for declaring reproducibility, (c). These figures continue the example from Figure 1. Panel (b) shows a stacked histogram of the maximum rank statistics, illustrating a clear change in behavior between reproducible (light gray) and irreproducible (dark gray) components. It is this transition that we hope to detect using the MaRR procedure.