
Figure 5.
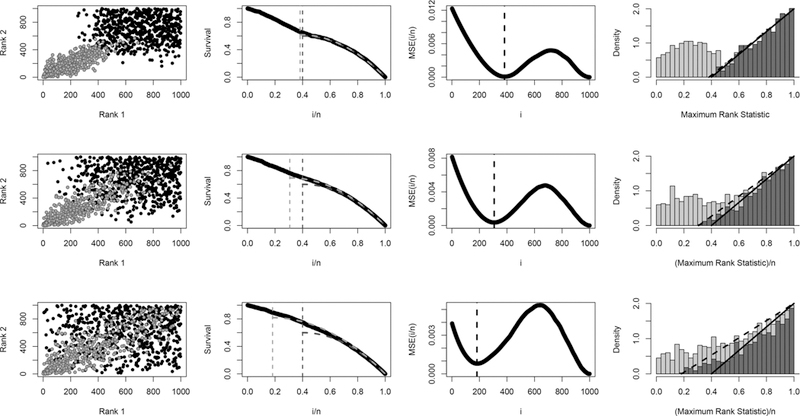
Illustration of MaRR procedure for three datasets of size n = 1000 with 400 reproducible signals: large effect size (row 1), moderate effect size (row 3), and small effect size (row 3). The first column shows rank pairs for both irreproducible (gray) and reproducible (black) signals. The second column presents the corresponding empirical survival curves (black) overlaid with the theoretical survival curve for the true (dark gray) and the theoretical survival curve for (light gray). Column three shows the MSEn curves used to determine for each dataset. Finally, column four gives the stacked histograms of Mg overlaid with theoretical irreproducible densities (dashed) and (solid). These densities intersect the x-axis at and respectively. As can be seen, the empirical survival curves most closely approximate theoretical curves with (column 2), and the estimate marks the approximate beginning of irreproducible signals (column 4).