
Figure 8.
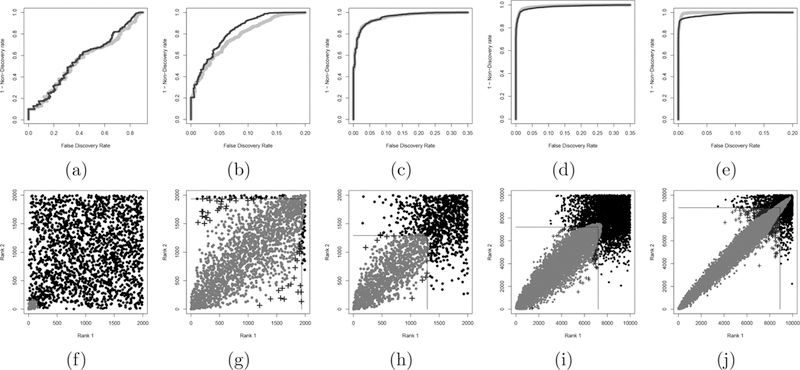
Discriminative (top row) and corresponding decision boundaries (bottom row) for representative datasets from simulations A and B. Top row, right and dark gray curves were calculated using the MaRR procedure and the copula mixture model respectively. In the bottom row, lines outline the square decision boundary of the MaRR procedure, and gray dots illustrate the decision boundary of the copula mixture model. The gray dots above and to the left of the lines are signals found to be reproducible by the copula model but not the MaRR procedure. Crosses are signals declared reproducible for the MaRR procedure but not for the copula model. From left to right: (a) and (f ) follow setting A with μA = 1, π1 = 0.1, ρ = 0.85; (b) and (g) follow setting A with μA = 1, π1 = 0.8, ρ = 0.85; (c) and (h) follow setting A with μA = 2, π1 = 0.65, ρ = 0.85; (d) and (i) follow setting B with r0 = 0.7, π1 = 0.65; (e) and (j) follow setting B with r0 = 0.95, π1 = 0.80.