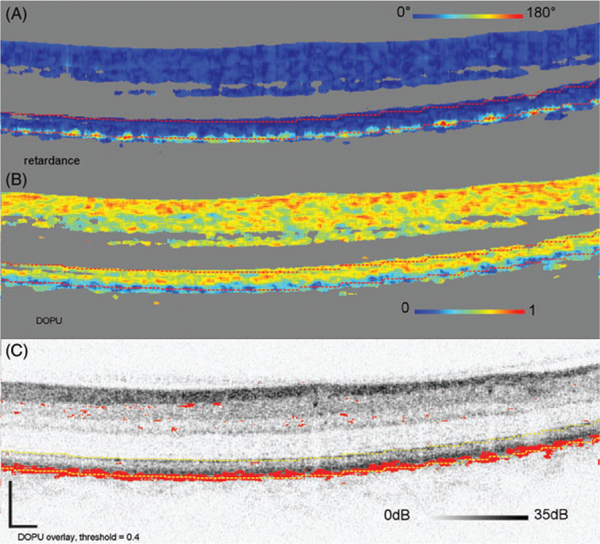
FIGURE 12.
Cumulative retardance (A), DOPU (B), and thresholded DOPU at 0.4, projected on top of the log intensity image (C). The threshold marks red DOPU values equal or lower than 0.4. B-scan is from Subject 14, one of the older subjects with high retardance below the RPEBM complex and reaching values up to 180°. These are associated with low-DOPU values (<0.4) in the RPE

