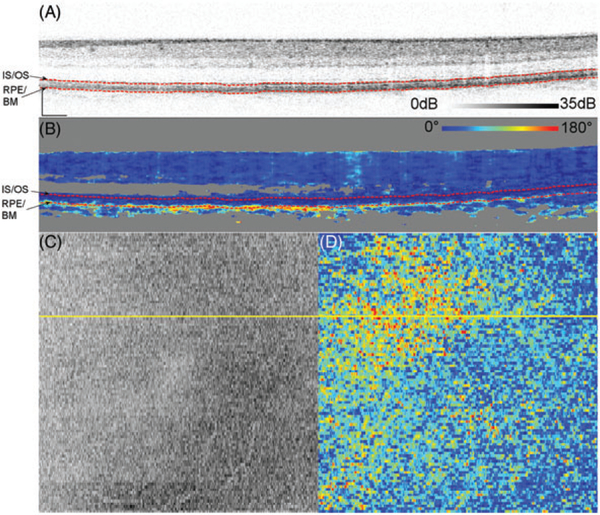
FIGURE 4.
Logarithmic intensity B-scan of the right eye of Subject 14, a 59-year-old (A). Scale bars in the lower left corner are 200 μm long. Panel (B) shows the cumulative DPPR encoded over 180°, and pixels that are near the noise floor are colored gray. A reference measurement was positioned at the segmented IS/OS (upper dashed red line). The DPPR induced between the IS/OS reference and the bottom of the RPE-BM complex (lower dashed red line) was measured. On the bottom left, an intensity C-scan (C) and bottom right an en face DPPR measurement (D) are shown. Segmentation for this data set was performed with a previously developed algorithm [29]

