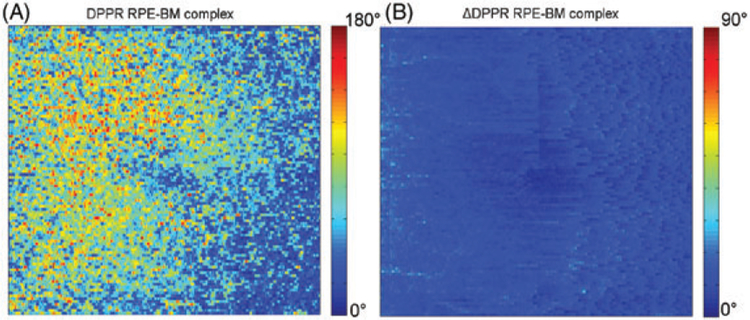
FIGURE 6.
DPPR accumulation between the IS/OS and basal side of the RPE-BM complex in Subject 14 (A), and predicted ΔDPPR due to phase noise based on intensity (B). Note that the ΔDPPR image is color-coded over a smaller range to better visualize the low noise in the image. Comparing the 2, we conclude the DPPR accumulation cannot be attributed to noise, as it is considerably larger in magnitude than the predicted noise level in the image, that is, ΔDPPR

