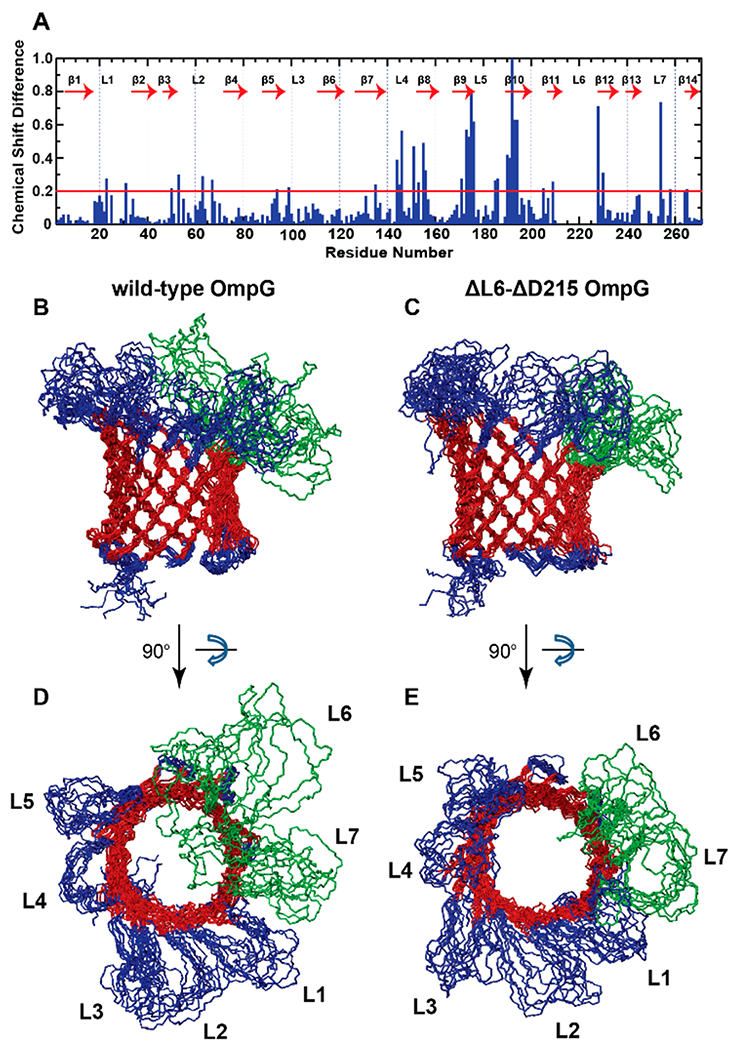
Figure 2.

Structural and dynamical changes between wild-type and mutant OmpG. (A) Chemical shift changes between ΔL6-ΔD215 and wild-type OmpG. A red line is drawn at 0.2 ppm, which is 5-fold higher than the estimated average measuring error. (B,D) NMR ensemble of the 10 lowest-energy structures of wild-type OmpG in side-view (B) and top-down view (D). (C,E) NMR ensemble of the 10 lowest-energy structures of ΔL6-ΔD215 OmpG in side-view (C) and top-down view (E). β-sheet residues are shown in red, N- and C-termini, periplasmic turns, and loops 1 to 5 are shown in blue, and loops 6 and 7 are shown in green. The β-sheet residues were used for superposition of the structures.
