
Figure 2. IRF3 Activation in Response to IL-1β Is cGAS and STING Dependent.
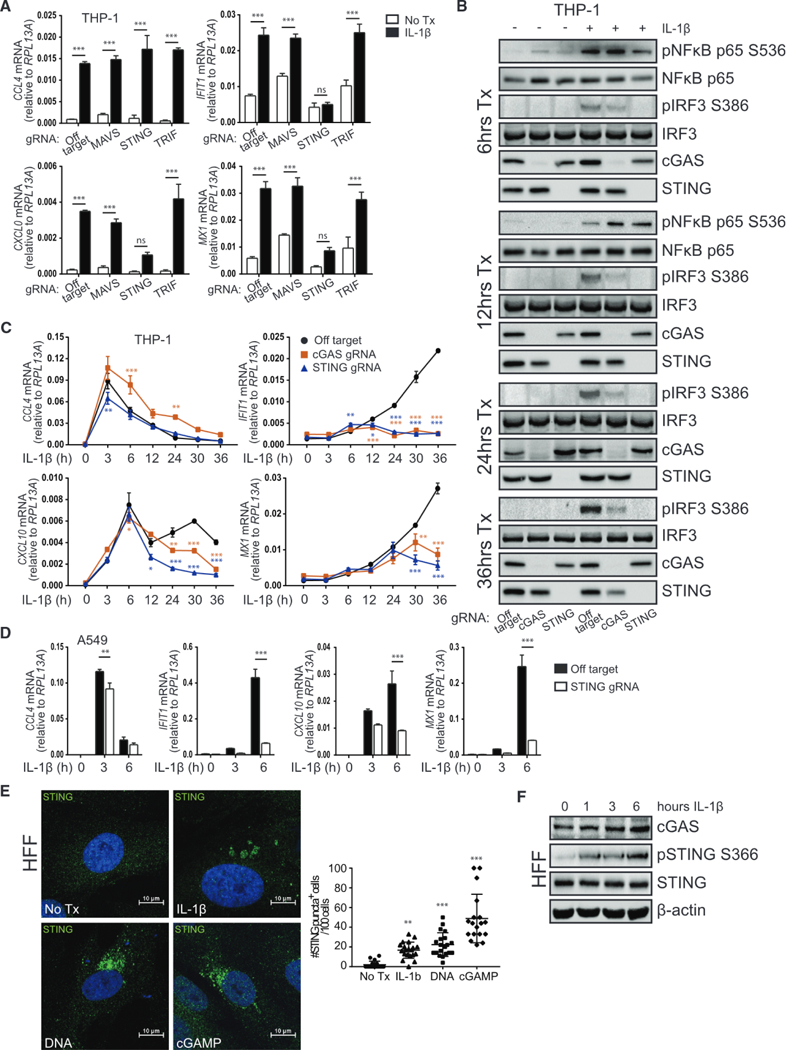
(A) THP-1 transduced with lentiCRISPR/Cas9 and off-target gRNA or MAVS-, STING-or TRIF-gRNA was treated with media or 10 ng/mL IL-1β for 30 h before qRT-PCR analysis. Statistical analysis was performed using two-way ANOVA and Bonferroni’s to compare treatments; n = 3 with mean ± SEM.
(B) THP-1 transduced with lentiCRISPR/Cas9 and off-target gRNA or cGAS-or STING-gRNA was treated with media or 10 ng/mL IL-1β for 6–36 h before protein analysis by immunoblot, n = 2.
(C) THP-1 transduced with lentiCRISPR/Cas9 and off-target gRNA or cGAS-or STING-gRNA was treated with media (0) or 10 ng/mL IL-1β for 3–36 h before qRT-PCR analysis. Statistical analysis was performed using two-way ANOVA with Bonferroni’s to compare knockouts to control cells; n = 4 with mean ± SEM.
(D) A549 transduced with lentiCRISPR/Cas9 and off-target gRNA or STING-gRNA was treated with media (0) or 10 ng/mL IL-1β for 3–6 h before qRT-PCR analysis. Statistical analysis was performed using Student’s t test and Holm-Sidak to compare genotypes; n = 3 with mean ± SEM.
(E) Left: HFFs were treated with media or 10 ng/mL IL-1β, transfected with 1 μg/mL calf thymus DNA, or transfected with 10 μg/mL cGAMP for 3 h on coverslips. Cells were fixed and stained for confocal imaging of STING (green). Nuclei were counterstained with DAPI (blue). Right: quantification of cells positive for STING puncta where each dot represents one field of view. Statistical analysis was performed using one-way ANOVA and Holm-Sidak; n = 4 with mean ± SD.
(F) HFF were treated with media (0) or 10 ng/mL IL-1β for 1–6 h before protein analysis by immunoblot, n = 2. *p < 0.05; **p < 0.01; ***p < 0.001. See also Figures S4 and S5.