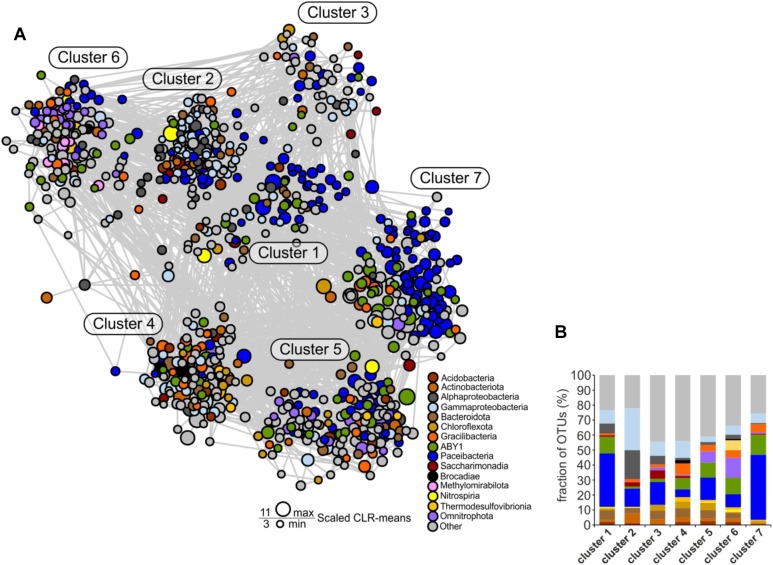
FIGURE 7.
Co-occurrence network of species-level OTUs across the two aquifer assemblages. For each sample, data sets from the 0.2 and 0.1 μm filter size fraction were merged. Only significant edges are displayed. (A) Co-occurrence network. Construction was based on a centered log-ratio (CLR) transformed OTU table and Meinshausen-Bühlmann neighborhood selection as graphical inference model. (B) Detailed view of the relative fraction of taxonomic groups across the seven clusters of the network.

