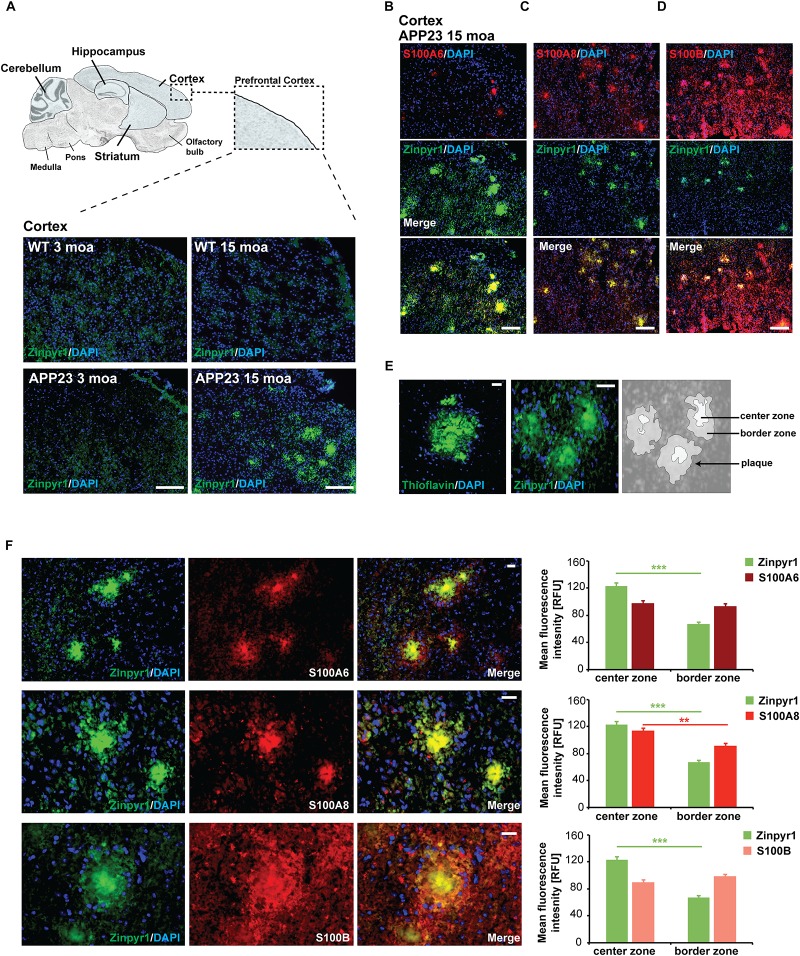
FIGURE 2.
Altered localization of S100 proteins in the brain of AP23 mice. (A) APP23 mice were compared to controls at 3 moa and 15 moa. Representative images of mouse prefrontal cortex are shown. A severe plaque-pathology was observed in 15 moa APP23 mice in this brain region. Plaques were visualized by Zinpyr-1 staining and cell nuclei labeled using DAPI. (B) In 15 mao APP23 mice, S100A6 signals co-localize with Aβ plaques together with (C) S100A8, and (D) S100B. Signal intensities have been adjusted to S100 fluorescence co-localizing with plaques leading to very low fluorescent signals in the surrounding tissue. (E,F) Visualization of plaques using Thioflavin or Zinpyr1 reveals strong fluorescence in the center of plaques and weaker fluorescence in the border zone corresponding to the aggregation state of Aβ. (F) S100A8 is significantly higher enriched in the center of Aβ aggregates (20–25 plaques each from n = 3 mice, t test, p = 0.0077). S100A6 is found in the center and periphery of Aβ plaques (pS100A6 = 0.3896). In contrast, S100B is found in the center zone and is slightly enriched in the border zone (pS100B = 0.1217). (A–D) scale bars = 300 μm, (E,F) = 50 μm.

