
Figure 2.
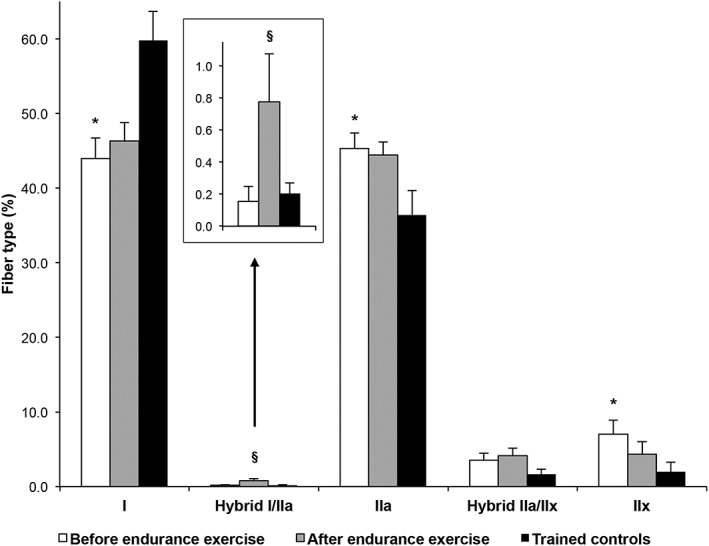
Fiber type distributions and exercise‐induced shift from fast glycolytic towards slow oxidative fibers. Bars are means ± SEM. *P < 0.05 vs. ‘trained controls’ by independent t‐test. § P < 0.05 vs. ‘before endurance exercise’ intervention by paired t‐test.