Figure 6.

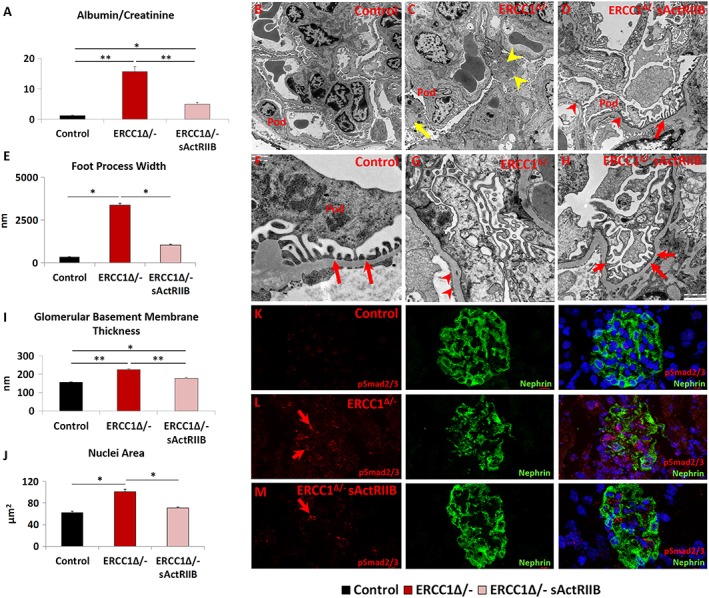
The prevention of kidney function abnormalities through the maintenance of the filtration barriers by sActRIIB treatment of Ercc1 Δ/− mice. (A) Urine protein measurements at the end of week 14. (B–D) Low and (F–H) high magnification of electron microscopy images of podocytes from control, mock‐treated Ercc1 Δ/−, and sActRIIB‐treated Ercc1 Δ/− mice. Pod indicates the podocyte. (C) Ercc1 Δ/− tissue contains autophagosomes (yellow arrow) and enlarged mitochondria (yellow arrowhead). (D) sActRIIB‐treated Ercc1 Δ/− mice show some foot process effacement (red arrowheads) but significant number of mature foot processes (red arrow). (E) Quantification of foot process width. (F) Numerous mature foot processes in control sample (red arrows). (G) Very few foot processes in Ercc1 Δ/− sample but thickened glomerular basement membrane (red arrowheads). (H) Treated Ercc1 Δ/− sample showing numerous mature foot processes (red arrows). (I) Quantification of glomerular basement membrane thickness. (J) Nuclear size measurements in Nephrin‐positive domain. (K) pSmad2/3 profile in control mice (red) in relation to podocytes, identified through Nephrin expression. (L) Abundant levels of pSmad2/3 (red arrows) in Ercc1 Δ/− podocytes. (M) Few pSmad2/3 puncta in sActRIIB‐treated Ercc1 Δ/− podocytes (red arrow). n = 8 mice examined for each cohort for (A) and n = 5 mice examined for each cohort for (EM). Analysis performed using non‐parametric Kruskal–Wallis test followed by the Dunn's multiple comparisons. *P < 0.05, **P < 0.01. sActRIIB, soluble activin receptor type IIB.
