Figure 1.

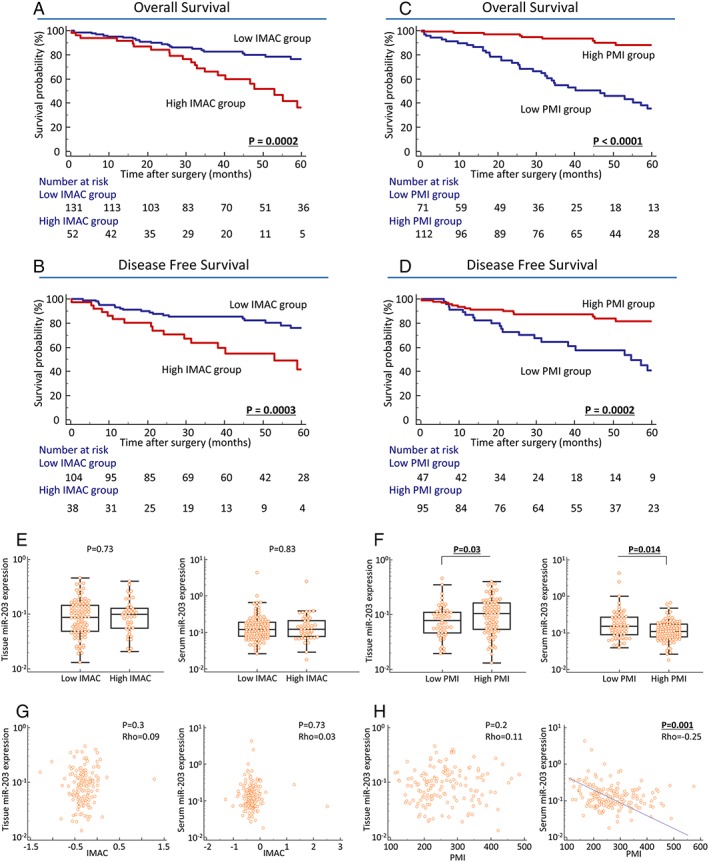
Prognostic impact of body composition (BC) status and its correlation with tissue or serum miR‐203 expression in colorectal cancer (CRC) patients (A–D). Prognostic impact of psoas muscle mass index (PMI) and intramuscular adipose tissue content (IMAC) in CRC patients. Kaplan–Meier survival curves for overall survival (OS) (A, C) and disease‐free survival (DFS) (B, D) in CRC patients based on IMAC or PMI status in CRC patients. High IMAC status was significantly correlated with poor prognosis in OS (P = 0.0002; log‐rank test, A) and DFS (P = 0.0003; log‐rank test, B). Decreased PMI significantly correlated with poor prognosis for OS (P < 0.0001; log‐rank test, C) and DFS (P = 0.0002; log‐rank test, D). (E, F) MiR‐203 expression in primary CRC tissues and pre‐operative serum specimens according to BC status. (E, F) Association between tissue and serum miR‐203 expression and BC status in CRC. (E) MiR‐203 expression in primary CRC tissues (left, P = 0.73) and pre‐operative serum specimens (right, P = 0.83) was not significantly associated with IMAC status in CRC patients. (F) Decreased miR‐203 expression in primary CRC tissues (left, P = 0.03) and elevated miR‐203 expression in pre‐operative serum (right, P = 0.014) were significantly associated with low PMI status in CRC patients. Statistically significant differences were determined using the Mann–Whitney U test. Cut‐off thresholds of PMI/IMAC were determined by receiver operating characteristic analysis with Youden's index for prognosis. (G, H) Direct correlation between tissue or serum miR‐203 expression and BC level in CRC patients. (G) MiR‐203 expression in primary CRC tissues (left, P = 0.3) and pre‐operative serum specimens (right, P = 0.73) did not significantly correlate with IMAC status in CRC patients. (H) No significant correlation was found between PMI level and miR‐203 expression in CRC tissues (left), but serum miR‐203 expression was negatively correlated with PMI level in CRC patients (right, P = 0.001, ρ = −0.25). Statistically significant differences were determined using the Spearman's rank correlation test, and all statistical tests were two sided.
