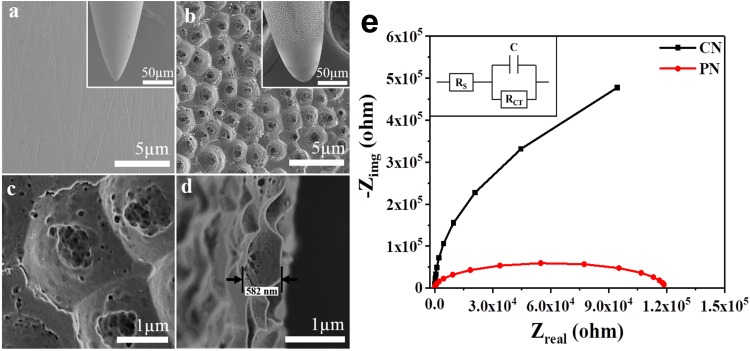
FIGURE 1.
Surfaces of the conventional needle (CN) (a) and micro-nanoporous needle (PN) (b). High-resolution image of the PN acupuncture needle (c) and cross-sectional image of the PN anodized needle (d). Electrochemical impedance spectra (EIS) with fitted Nyquist plots corresponding to the CN and PN (e). The inset shows equivalent circuits for EIS measurements, where RS = solution resistance, RCT = charge transfer resistance, and C = double layer capacitance.

