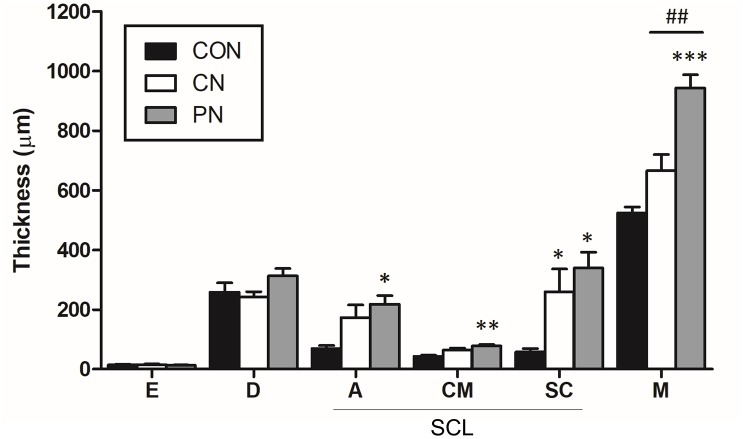
FIGURE 6.
Thickness of each layer in the abdominal wall. The thickness of each tissue layer was measured at the epidermis (E), dermis (D), adipose (A), cutaneous muscle (CM), subcutaneous connective tissue (SC), and abdominal muscle (M). SCL represents the subcutaneous layer. ∗P < 0.05, ∗∗∗P < 0.001, compared to the CON group; one-way ANOVA followed by the Bonferroni test; each n = 4–5. Error bars indicate the SEM.

