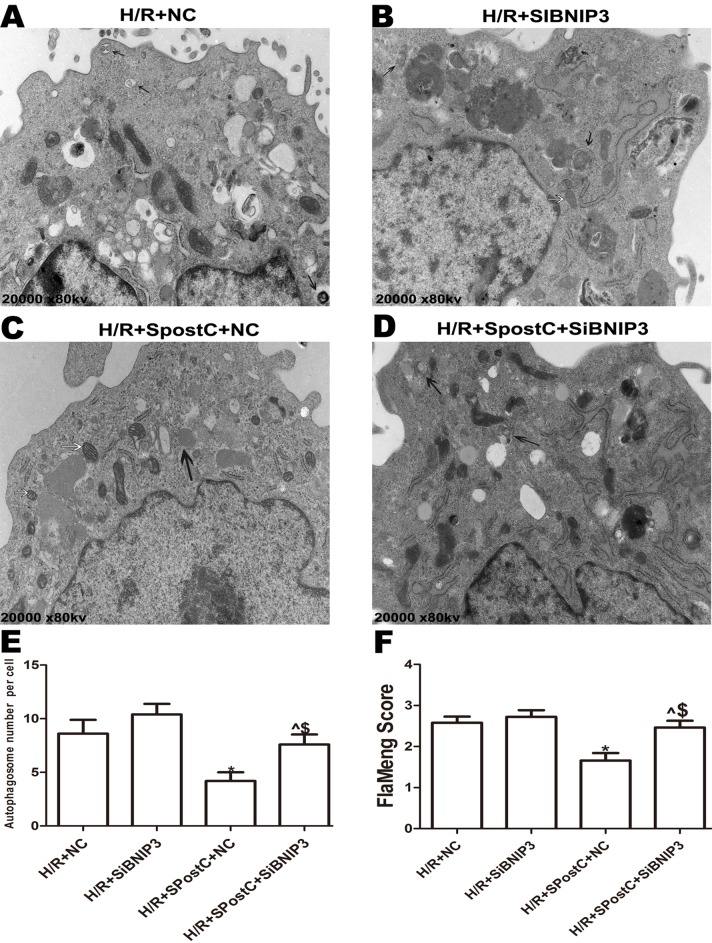
Figure 7. Mitochondrial structure and autophagosomes under electron microscopy after silencing of BNIP3.
Autophagosomes are indicated by black arrows, mitochondria are indicated by white arrows. Flameng score indicating mitochondrial damage, the higher the score, the more severe the mitochondrial damage. Mitochondria were swollen in the BNIP3 silencing group, and autophagosomes were significantly accumulated. (A) H/R+NC group (B) H/R+siBNIP3 group (C) H/R+SpostC+NC group (D) H/R+SpostC+siBNIP3 group (E) Autophagosome number per cell (F) FlaMeng Score. Data represent mean ± SD (n = 5/group) (^P < 0.05 vs H/R+siBNIP3 group, *P < 0.05 vs H/R+NC group, $P < 0.05 vs H/R+SpostC +NC group).

