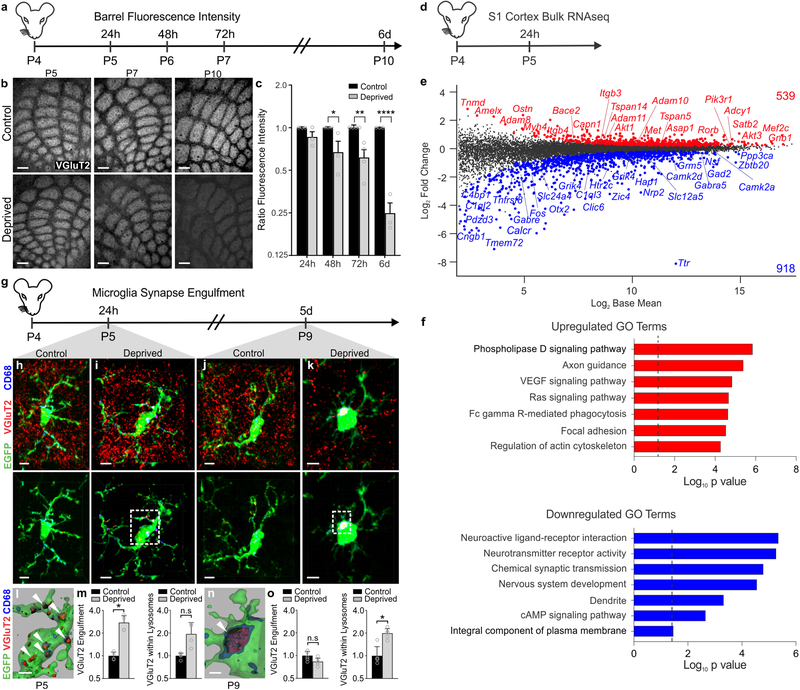
Figure 1. Whisker lesioning induces microglial engulfment and elimination of TC inputs within the barrel cortex.
a, Timeline for analysis of TC input elimination following whisker lesioning at P4. b, Tangential sections of layer IV contralateral control (top panel) and deprived (bottom panel) barrel cortices immunolabeled for anti-VGluT2 show a decrease in TC inputs by P10. Scale bar, 150 μm. c, Quantification of fluorescence intensity of VGluT2-positive TC inputs in the barrel cortex in the deprived (gray bars) compared to the control barrel cortex (black bars) at each time point post-whisker removal. Data normalized to the control, non-deprived hemisphere within each animal. (Two-way ANOVA with Sidak’s post hoc; control vs deprived 24h, n = 3 animals, P = 0.5323, t = 1.419, df = 18; control vs deprived 48h, n = 3 animals, P = 0.0142, t = 3.349, df = 18; control vs deprived 72h, n = 4 animals, P = 0.0011, t = 4.516, df = 18; control vs deprived 6d, n = 3 animals, P <0.0001, t = 7.631, df = 18). d, Timeline for bulk RNAseq of the barrel cortex 24 hours after whisker lesioning. e-f, MA plot (representing log-ratio (M) on the y axis and mean average (A) on the x axis) shows gene expression changes (red, upregulated; blue, downregulated) in the deprived somatosensory cortex at P4 (DESeq2, n = 5 mice, P5). Horizontal bar graphs show selected gene ontology (GO) annotations (Enrichr) enriched for up- (red) or downregulated (blue) genes; dotted lines, P = 0.05. g, Timeline for analysis of TC input engulfment by microglia. h,i,j,k, Fluorescent images of microglia (green) within layer IV of the control (h,j) and deprived (i,k) barrel cortices 24 h (h,i) and 5 d (j,k) after unilateral whisker removal. Microglial lysosomes are labeled with anti-CD68 (blue). Raw fluorescent images, top panel; VGlut2 signal internalized within microglia, bottom panel. Scale bar, 5 μm. l,n, 3D surface-rendered inset of i,k (bottom panel). Arrows depict VGlut2 (red) internalized within microglia (green) and within lysosomes (blue). Scale bar, 2 μm. m,o, Quantification of VGlut2 engulfment within microglia (left) and VGlut2 engulfment within lysosomes (right) 24 h (m; within microglia, Two-sided Student’s t-test, n = 4 animals, P = 0.0305, t = 2.642 df =6; within lysosomes, Two-sided Student’s t-test, n = 4 animals, P = 0.2955, t = 1.146, df =6) and 5 d (o; within microglia, Two-sided Student’s t-test, n = 5 animals, P = 0.3319, t =1.033, df =8; within lysosomes, Two-sided Student’s t-test, n = 5 animals, P = 0.0272, t =2.251, df =8) after whisker removal in Cx3cr1EGFP/+ microglia reveals increased VGluT2 within microglia at 24 h (m) and increased VGluT2 within microglial lysosomes at 5 d-post whisker removal (o). Data normalized to engulfment in microglia in the control hemisphere within each animal. All data presented as mean ± SEM.

