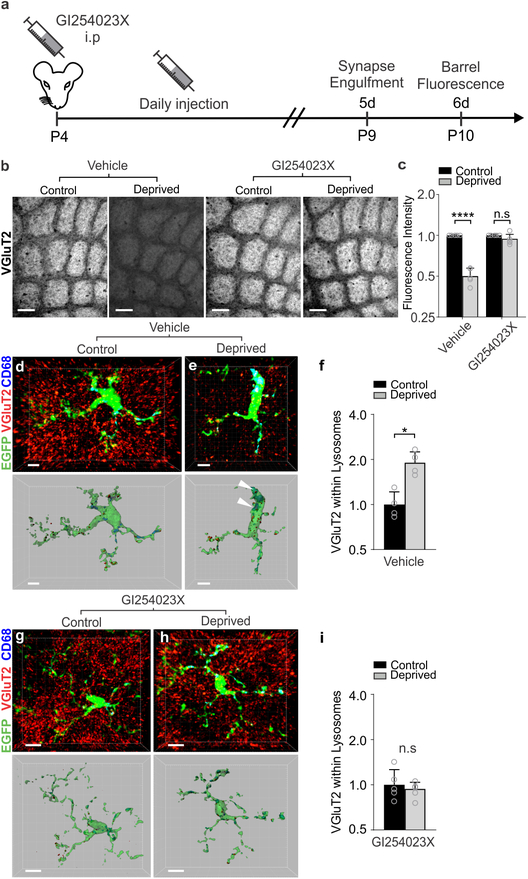
Figure 8. Pharmacological inactivation of ADAM10 phenocopies TC synapse elimination defects in Cx3cr1−/− and Cx3cl1−/− mice.
a, Timeline for pharmacological inhibition of ADAM10 via daily 25 mg/kg GI254023X injections intraperitoneally. b, Inhibition of ADAM10 (right panels), but not vehicle treatment (left panels), blocks TC input loss as visualized by immunostaining for VGluT2. Scale bars, 150 μm. c, Quantification of VGluT2 immunostaining intensity 5 days-post whisker lesioning and GI254023X injections (Two-Way ANOVA with Sidak’s post hoc, n = 5 Cx3cr1+/+ animals per condition, Vehicle control vs deprived, P <0.0001, t = 6.782, df = 16; GI254023X control vs deprived, P = 0.9715, t = 0.7789, df = 16). d,e, Representative microglia from the control (d) and deprived (e) cortices of vehicle treated Cx3cr1EGFP/+ mice. Top panel displays raw fluorescent image with microglia (EGFP, green) VGluT2 inputs (red) and lysosomes (Anti-CD68, blue) labeled. Bottom panels shows 3D-surface rendering of these cells. Engulfed VGluT2 (red) immunoreactive TC inputs within microglia are visualized in Cx3cr1EGFP/+ microglia (e, arrows)) in the deprived cortex but not the control cortex (d). Scale bars, 5 μm. f, Quantification of engulfed VGlut2 5 days after whisker lesioning reveals increased engulfment in the deprived cortex of vehicle treated mice. Data normalized to engulfment in the control hemisphere within each animal. (One-tailed Student’s T-test, n = 4 Cx3cr1EGFP/+ mice, control vs deprived P = 0.0455, t = 2.012, df = 6.) g,h Representative microglia from the control (d) and deprived (e) cortex of GI254023X treated Cx3cr1EGFP/+ mice 5 days after whisker lesioning. Scale bars, 5 μm. i, Quantification of engulfment 5 days-post whisker lesioning in GI254023X treated mice reveals a blockade of engulfment following ADAM10 inhibition. Data normalized to engulfment in the control hemisphere within each animal. (Two-tailed Student’s T-test, n = 4 Cx3cr1EGFP/+ mice, control vs deprived P = 0.8291, t = 0.2231, df = 6). All data presented as mean ± SEM.

