
Figure 15.
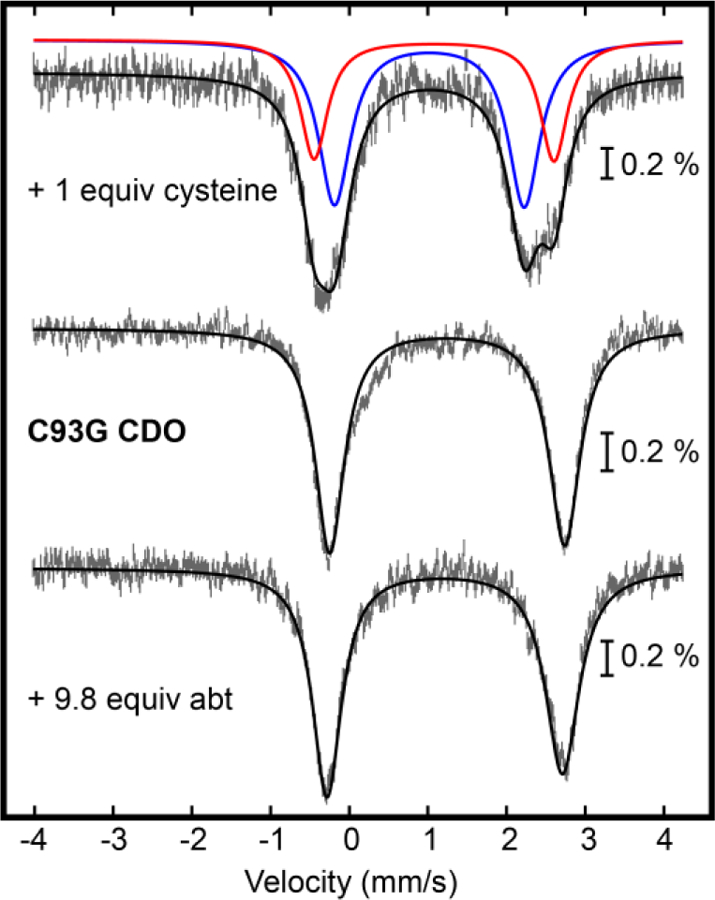
Mössbauer spectra of C93G CDO (middle) in the presence of 1 equiv cysteine (top) and 8.8 equiv abt (bottom). Fits are shown as red, blue, or black lines.
Official websites use .gov
A
.gov website belongs to an official
government organization in the United States.
Secure .gov websites use HTTPS
A lock (
) or https:// means you've safely
connected to the .gov website. Share sensitive
information only on official, secure websites.
Mössbauer spectra of C93G CDO (middle) in the presence of 1 equiv cysteine (top) and 8.8 equiv abt (bottom). Fits are shown as red, blue, or black lines.