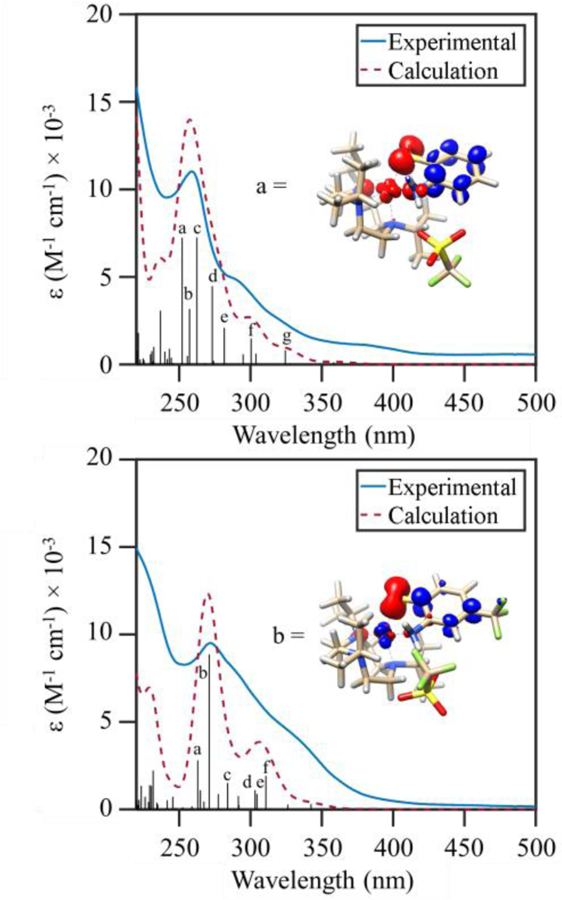
Figure 4.

TD-DFT computed absorption spectra for 3 (top) and 4 (bottom) (red dashed line) overlaid with experimental spectra (blue line). The black sticks and letters mark the energies and intensities of specific vertical excitations. Electron density difference maps for representative computed transitions are shown with the blue and red regions indicating gain and loss of electron density, respectively.
