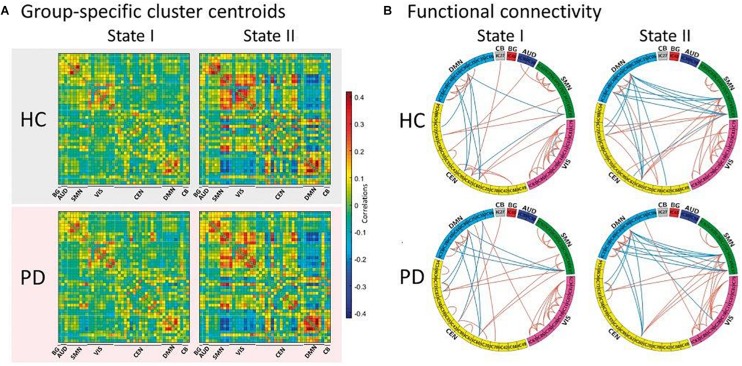
FIGURE 2.
Functional connectivity state results. (A) Group-specific cluster centroid for each state, averaged across subject-specific median cluster centroids of each group [percentage of total occurrences for stage I and II: 83.4% and 16.6% in the healthy controls (HC) and 70.8% and 29.2% in the Parkinson’s disease (PD) group, respectively]. (B) Functional connectivity in each state is shown for healthy controls and Parkinson’s disease groups, representing the 5% of the functional connectivity network with the strongest connections. BG, basal ganglia; AUD, auditory; SMN, sensorimotor; VIS, visual; CEN, cognitive executive; CB, cerebellar network (reproduced with permission from Kim et al., 2017).

