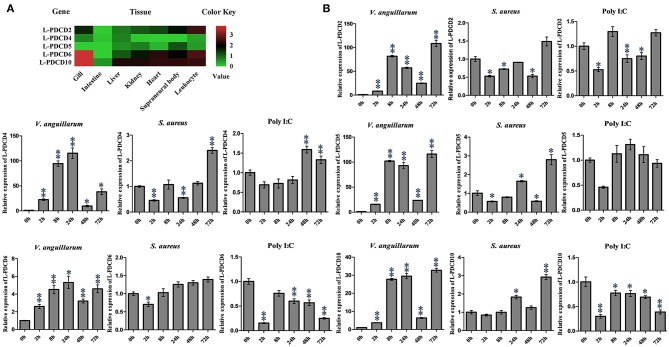
Figure 3.
The expression profiles of lamprey PDCD family genes. (A) RT-PCR analysis of the L-PDCD family genes in lampreys characterizing L-PDCD mRNA expression in adult tissues. The mRNA expression levels of L-PDCD family genes are expressed as a ratio relative to the GAPDH mRNA expression levels. The expression profile for lamprey PDCD family genes are shown by using a heat map. The green and red colors indicate low to high expression levels. (B) Q-PCR analysis of the expression patterns of L-PDCD2, L-PDCD4, L-PDCD5, L-PDCD6, and L-PDCD10 at 0, 2, 8, 24, 48, and 72 h after the challenges with Gram-negative V. anguillarum (1 × 10⁷ cells/fish), Gram-positive S. aureus (1 × 10⁷ cells/fish), and the viral mimic pathogen Poly I:C (100 μg/fish) in the leukocytes of lampreys. All of the data are presented as the means ± SDs based on three independent cDNA samples with three replicates per sample. The asterisks indicate significant differences (n = 3, **P < 0.01 and *P < 0.05) compared to the control.

