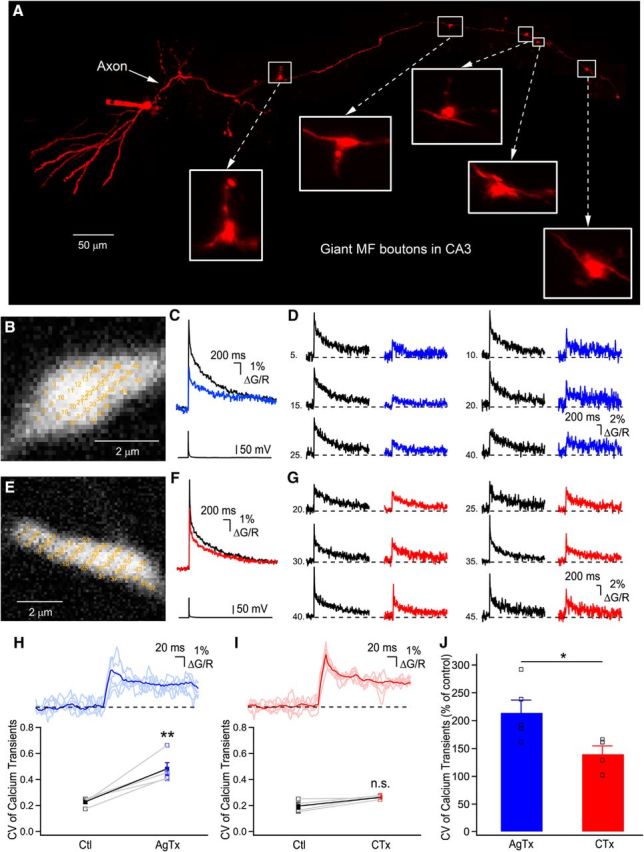
Figure 1.

Distinct spatial profiles of Ca2+ elevations generated by P/Q- or N-type VGCCs. A, Photomontage of two-photon z-stack maximal projections showing an intact AlexaFluor-594-filled granule cell axonal arbor projecting to the CA3 region. B, Expanded large MF boutons showing the recording sites (yellow numbers) for RAMP Ca2+ imaging. Note that the yellow numbers are intentionally large to be readable. C, Bouton-averaged Ca2+ elevations recorded in B evoked by a single AP in control (black) and in the presence of AgTx (blue). D, Examples of single voxels Ca2+ elevations in control condition and following application of AgTx. Traces shown are the average of 20 trials. E, Recording sites are indicated on a large MF terminal for data shown in F and G. F, Bouton-averaged calcium elevations recorded in control (black) and in presence of CTx (red), and corresponding single-voxel examples (G) in control (black) and in CTx (red). Traces are average of 20 trials. H, Top, Traces of single voxel examples shown in D, with their average overlaid. Note the large deviations from the average. Bottom, Plot showing the spatial CV of peak Ca2+ transients in control and following the application of AgTx. I, Top, Overlay of the traces shown in G, with their average. Bottom, Plot showing the effect of CTx on the spatial CV of peak Ca2+ elevation (n.s. = nonsignificant; p > 0.05). J, AgTx increases the spatial heterogeneity of Ca2+ elevations significantly more than CTx. Data represent mean ± SEM. *p < 0.05, **p < 0.01.
