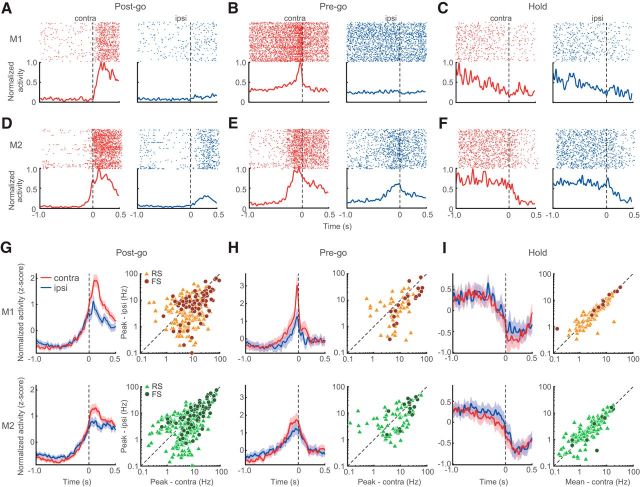
Figure 4.
Selectivity of neuronal activity to contralateral and ipsilateral movements in the motor cortices. A–C, Examples of Post-go-, Pre-go-, and Hold-type functional activities in the M1 neurons in the contralateral (red) or ipsilateral trials (blue). Colored dots and lines indicate spike raster plots and normalized PETHs, respectively. D–F, Same as A–C for the M2 neurons. G–I, Population data of three types of functional activity in the M1 (top) and M2 (bottom). Left columns, Averaged PETHs of all Post-go-, Pre-go-, and Hold-type activities for the contralateral (red) and ipsilateral (blue) choice trials. Shaded regions represent 95% CIs. Right columns, Peak activity (G, H) and mean firing rate (I) of the contralateral (abscissa) and ipsilateral (ordinate) choice trials. Triangles and circles represent individual RS and FS neurons, respectively.

