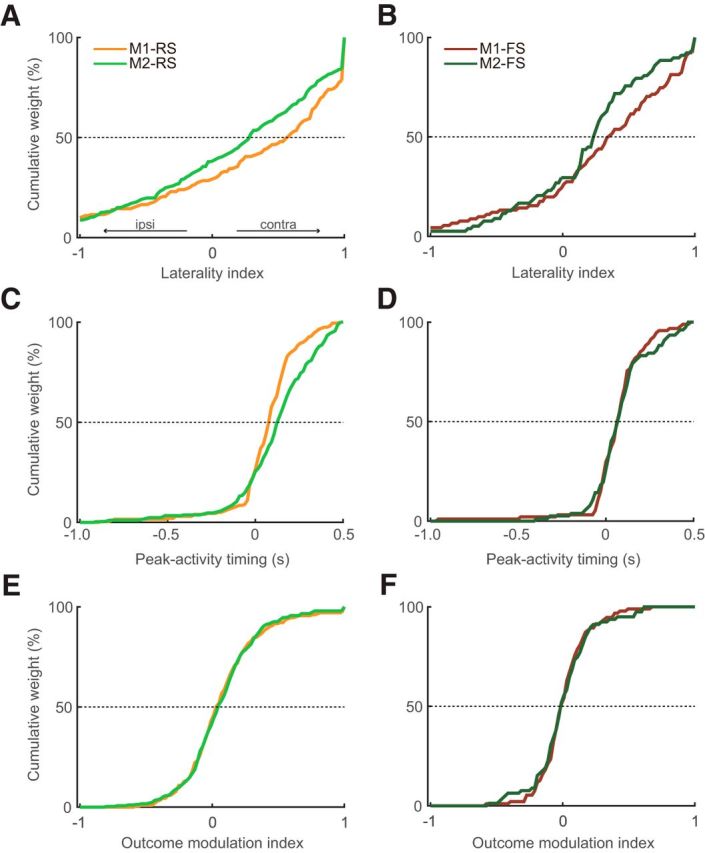
Figure 5.

Laterality indices, peak-activity timing, and outcome modulation indices of Go-type activity in M1 and M2 neurons. A, B, Cumulative distributions of the laterality indices for RS (A) and FS (B) neurons in the M1 and M2. Positive and negative values indicate greater activity for contralateral and ipsilateral movements, respectively. M1 neurons preferentially represented the contralateral forelimb movements to a greater extent than M2 neurons (rightward shift). C, D, Cumulative distributions of the peak-activity timing for RS (C) and FS (D) neurons. E, F, Cumulative distributions of the outcome modulation indices for RS (E) and FS (F) neurons. Positive and negative values indicate greater activity for rewarded and nonrewarded trials, respectively (see Materials and Methods).
