Figure 6.
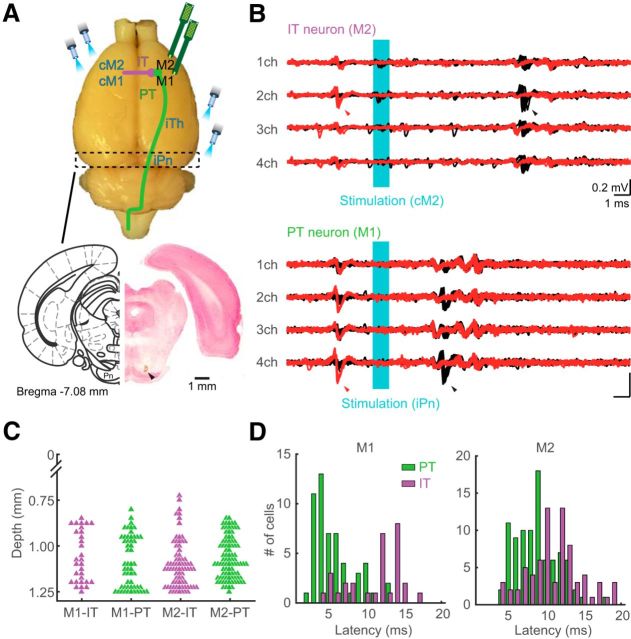
Identification of IT and PT neurons. A, Top, Schema showing the position of optical fibers for identifying the IT and PT neurons. The contralateral motor cortex (cM1 or cM2), and either ipsilateral ventral nuclei of thalamus (iTh) or pontine nuclei (iPn) were stimulated for identification of IT and PT neurons, respectively. Bottom, Stimulation site for identification of PT neuron. Track of an optical fiber (arrowhead) into the iPn in a Nissl-stained section. B, Examples of recordings from IT (top) and PT (bottom) neurons during optical stimulation (cyan area), with spike collisions. Black and red traces represent the antidromic spikes to optical stimulation and spike collision tests, respectively. Black arrowheads indicate antidromic spikes. Red arrowheads indicate the precedence of spontaneous spikes used as triggers for optical stimulation in collision tests. C, Reconstructed recording position of IT (purple) and PT (green) neurons in the motor cortices. The electrode insertion based on the antidromic identification of PT neurons enabled to specify putative layer 5 (see Materials and Methods). D, Distribution of spike latency after antidromic stimulation in IT (purple) and PT (green) neurons of M1 (left) and M2 (right).

