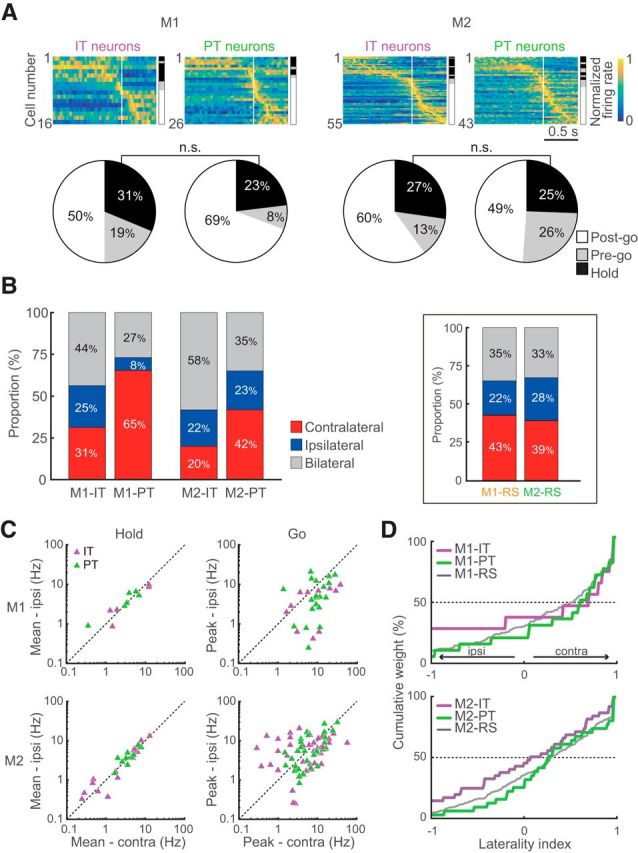
Figure 7.

Functional activity and motor laterality of IT and PT neurons. A, Functional activity (top) and fraction (bottom) of IT and PT neurons in M1 and M2. Legend is the same as Figure 3D. B, Proportion of neurons selective for contralateral, ipsilateral, or bilateral movement. Stacked bar graphs represent the ratios of selectivity in IT and PT neurons in the motor cortices. Each category is color-coded: red represents contralateral neurons; blue represents ipsilateral neurons; gray represents bilateral neurons. Insets, Same as B for unidentified RS neurons in the M1 and M2. C, Mean activity (for Hold-type; left column) and peak activity (for Go-type; right column) of the contralateral and ipsilateral movement trials in the IT (purple) and PT (green) neurons. D, Cumulative distributions of the laterality indices for IT and PT neurons in M1 (top) and M2 (bottom). Gray lines are the same as Figure 5A.
