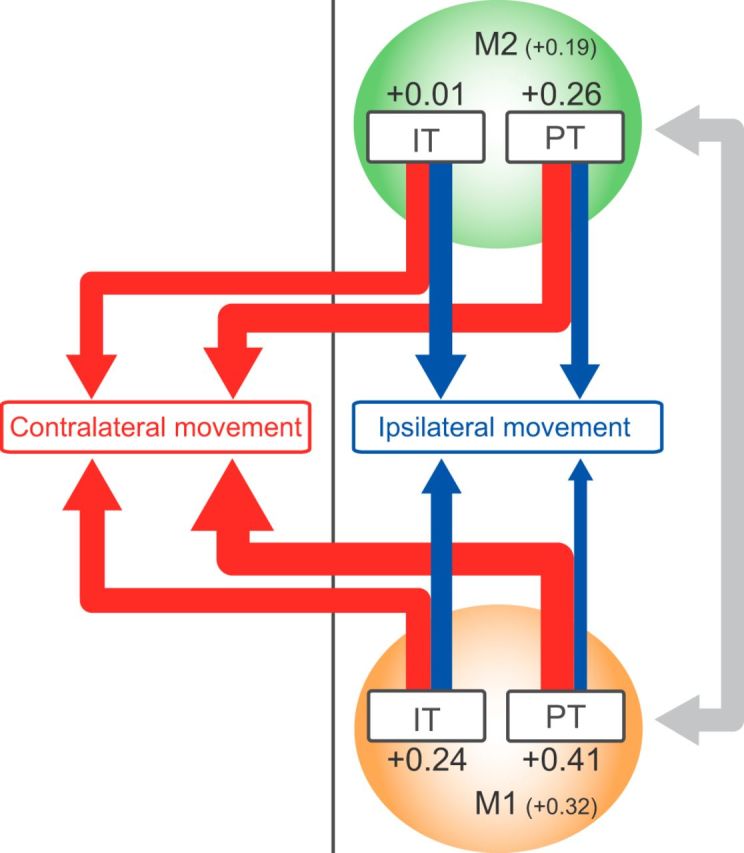
Figure 8.

Schematic summary of laterality in motor representation in IT and PT neurons in M1 and M2. Red and blue arrows indicate neuronal activity for contralateral and ipsilateral movements, respectively. The relative strength is indicated by thickness of arrow. The number indicates averaged laterality index for each neuron type. The M1 and M2 neurons may cooperatively communicate with each other to control the movements (gray arrow).
