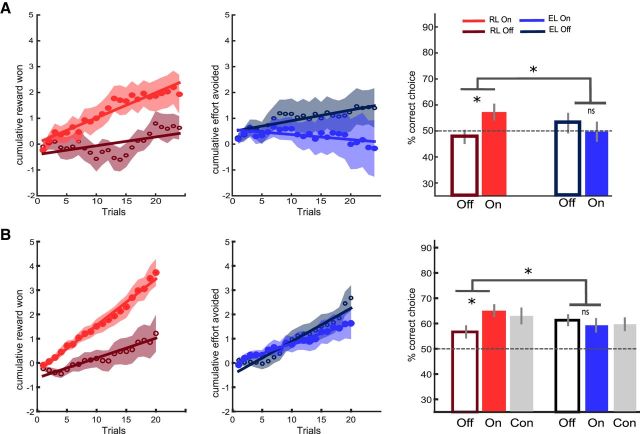
Figure 2.
Behavioral results of Study 1 (A) and Study 2 (B). Left, Learning curves show cumulative scores, that is, money won (big minus small reward) in the reward context (empty and filled red circles for OFF and ON medication states, respectively) and effort avoided (low minus high effort outcomes) in the effort context (empty and filled blue circles for OFF and ON states, respectively). Shaded areas represent trial-by-trial intersubject SEM. Lines indicate linear regression fit. Right, Bar graphs show mean correct response rates (same color coding as for the learning curves, with gray bars for the control group in Study 2). Dotted lines correspond to chance-level performance. Error bars indicate ± intersubject SEM. Stars indicate significant main effects of treatment and interaction with learning condition (p < 0.05). CON, Control; EL, effort learning; RL, reward learning.

