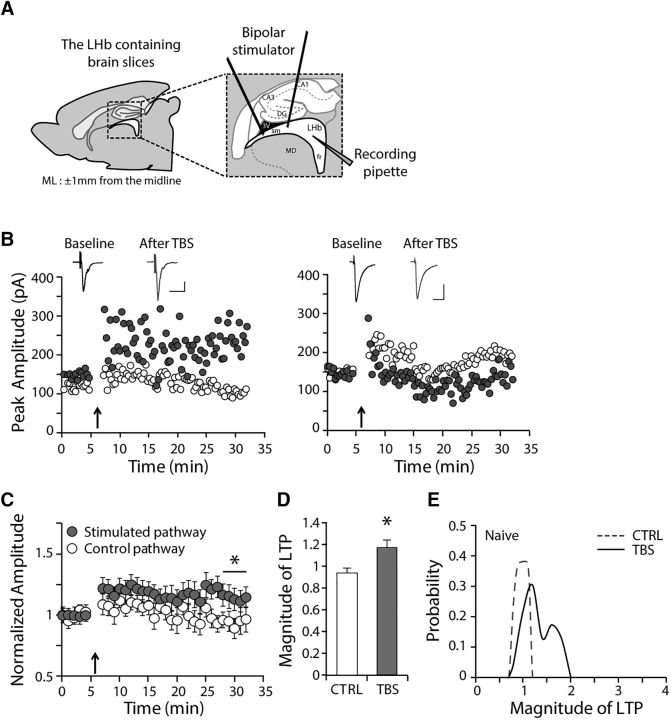
Figure 1.
Mild long-term potentiation occurs in the LHb. A, Recording configuration. B, Examples of TBS-induced (5 stimuli at 100 Hz, repeated 20 times with 200 ms intervals) synaptic potentiation in the LHb obtained from naive animals. Left, Example of a potentiated LHb neuron. Right, Nonpotentiated LHb neuron. Calibration: 20 ms, 100 pA. C, Summary of compiled data for normalized amplitudes of eEPSCs before and after TBS (117.7 ± 6.9% of baseline for stimulated pathway, n = 16, p < 0.05 compared with before TBS or the control pathway). D, Averaged magnitude of LTP after TBS in naive animals (CTRL: unstimulated control pathway; TBS: stimulated pathway). E, The distribution of probability plot for the magnitude of LTP in naive animals. *p < 0.05.

