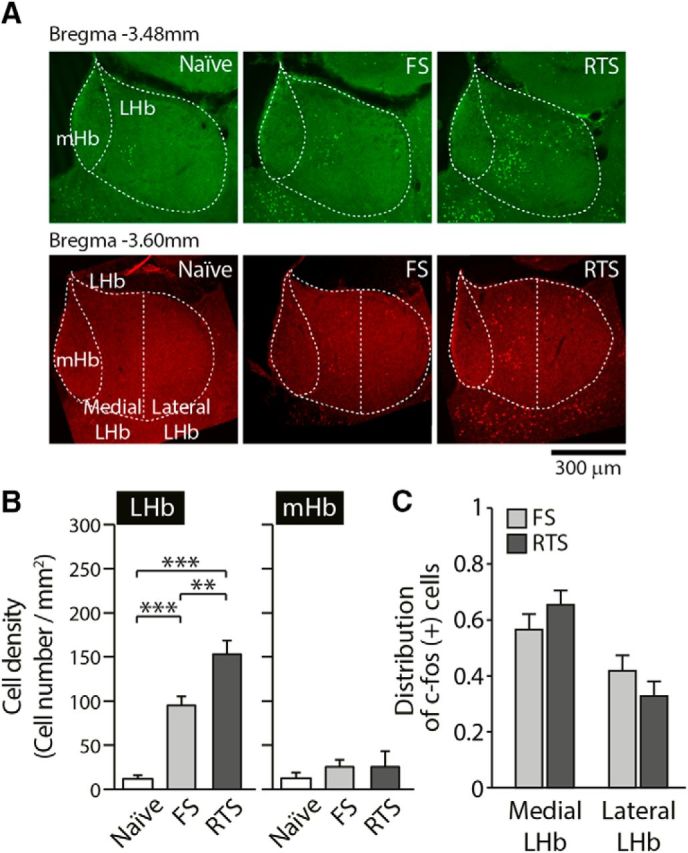
Figure 3.

Exposure to stressors activates LHb neurons. A, Representative images of c-fos immunoreactivity in each group. B, The density of c-fos-positive cells in the LHb (right) was significantly increased after exposure to FS or RTS but not in the mHb (left) (one-way ANOVA, F(2,17) = 2.3, p > 0.1 for the mHb; F(2,19) = 38.26, p < 0.001 for the LHb, p < 0.001 when comparing naive vs FS animals, p < 0.001 when comparing naive vs RTS animals, Bonferroni post hoc analysis). In addition, the LHb showed significantly more c-fos-positive cells following RTS than after FS exposure (p < 0.01, Bonferroni post hoc analysis). C, Densities of c-fos-positive cells in the medial part of the LHb (medial LHb) and the lateral part of the LHb (lateral LHb) were analyzed 45 min after exposure to FS and RTS. The distributions of c-fos-positive cells do not differ in FS versus RTS animals (5 animals per group, 10 sections averaged per animal, two-way ANOVA, F(1,16) = 2.41, p > 0.1). **p < 0.01. ***p < 0.001.
